In the article the results of work on the assessment of the genetic diversity of Kazakhstani coenopopulations of a rare plant species Adonis wolgensis Stev. are presented. Samples for research were collected in five cenopopulations of Kostanay, Akmola, Pavlodar regions of the Republic of Kazakhstan. The genome of A. wolgensis is not sequenced, therefore, a PCR method was used to detect DNA polymorphism in coenopopulations of this species for the simultaneous detection of multilocus DNA polymorphism that did not require initial knowledge of the nucleotide sequences of the entire genome or its parts. One of the most common methods for detecting genetic polymorphism in plants is ISSR-labeling (Inter Simple Sequence Repeats, or intermicro-satellite analysis). For PCR we used five primers with a length of 17–22 nucleotides. Separate amplification was carried out with each of them. Such primers allowed to amplify DNA fragments that are between two closely spaced microsatellite sequences. As a result, a large number of fragments, represented on the electrophoregram by discrete bands (ISSR-fingerprinting), was amplified. In total, more than 450 analyzes were performed (including repeated studies). As a result, multiple genomic marking of five coenopopulations of A. wolgensis in northern Kazakhstan was carried out, the main indicators of genetic diversity, the structure and differentiation of gene pools of populations, the studied plant species were determined.
Introduction
The most important component of the biosphere is biological diversity. The concept of «biological di- versity» covers all the diversity and variability of living organisms, including their relationships with each other and varying degrees of connection with the natural environment. This fundamental property of living nature reflects the great number of structural and functional properties of its organization realized in the process of evolution and ensures the stable development of planetary life and the stability of the biosphere.
Decrease in species and genetic diversity is a real threat to the biosphere, since the sustainability of the reproduction of natural ecosystems is directly related to their genetically determined adaptation potential to changing environmental conditions. Genetic diversity, that is, maintaining genotypic heterozygosity, polymorphism, and another genotypic variability, which is caused by adaptation in natural populations, plays an important role in the integrated assessment of biodiversity [1, 2].
One approach to the study of plant genetic diversity is the use of molecular markers, which are polymorphic DNA sequences that can be detected using methods based on polymerase chain reaction (PCR). Polymorphism of nucleotide sequences between individual DNA samples is detected by the presence or absence of specific DNA fragments in the spectrum during electrophoresis. The absence of a DNA fragment may be the result of point mutations, insertions, deletions, or inversions in the DNA template sequence [3].
In the genomes of plants, the number of microsatellite repeats is very large, which makes this method convenient for genetic analysis. Microsatellite sequences surround a lot of genes and can be used as anchoring sequences for these genes. For selecting primers, the ISSR method for determining polymorphism of DNA does not require prior cloning and sequencing. Primers for intermicrosatellite analysis, that is, ISSR primers (Inter Simple Sequence Repeats), consist of a fragment of a microsatellite locus (di- or trinucleotide, most often) and 1 or 2 «anchor» nucleotides on one of the flanks of the repeat. The development of this method was started in 1994, and now it has become widespread, especially in studies of the gene pools of various plant species, for mapping genomes and marking agronomically important traits [4, 5].
Molecular genetic methods are of particular importance for solving the main problem in maintaining biodiversity which is the selection of the most typical representatives of populations and the creation of genetically based programs for their conservation, as well as the identification of intraspecific genetic diversity,the assessment of heterozygosity, the reconstruction of phylogenetic relationships between species and the spatial relationships between populations [6].
Due to the peculiarities of the historical development, the flora and vegetation of Northern Kazakhstan is unique. Its genetic foundation was formed in the course of a long evolution and now provides the possibility of the existence of populations of species in the modern physiographic environment. Economic development, development of modern infrastructure and tourism in the territory of Northern Kazakhstan inevitably entails the enhanced exploitation of natural resources. In addition, the increasing anthropogenic load, the destruction of places of growth due to construction and other economic activities (gathering mushrooms, berries, tourism) leads to a gradual degradation of typical cenoses.
On the territory of Northern Kazakhstan, such species of the genus Adonis L. as Adonis vernalis L. and Adonis wolgensis Stev. grow up, they are included in the approved list of rare plant species of Kazakhstan [7]. Species of the genus Adonis L. have considerable practical interest, since most of them contain cardiac glycosides, adonis preparations are used to treat a number of diseases of the cardiovascular and nervous systems, kidney and urinary tract diseases. On the territory of the former USSR in the twentieth century, due to the unplanned barbaric harvesting of Adonis L. plants as a medicinal raw material, the coenoarea of this species was significantly reduced and disintegrated into five isolated sections which are located in the Ishim upstream, in Northern Kazakhstan, in Aktobe and Kostanay regions [8].
The area of A. wolgensis is significantly smaller compared to A. vernalis. Distribution of A. wolgensis within the range is uneven, there is a tendency to disjunction.
Individuals of A. wolgensis have a short, thick, brownish-black rhizome, few stems 15-30 cm in height. Young leaves and stems are abundantly pubescent, after fading, absently pubescent. The leaves are heavily dissected. The flowers are pale yellow, 3.5-4.5 cm in diameter. Sepals in length exceed half the length of the petals, slightly pubescent, lilac. A. wolgensis is listed in the Red Book of Kazakhstan.
Studying the genetic variability of natural populations, assessing the state of their gene pools allows us to compile genetically based programs for the conservation of both rare plant species and programs for the use of resource plants, taking into account their genetic diversity. Conservation of genetic resources includes measures that limit the increase in the average coefficient of kinship in populations and the preservation of existing genetic variability. The choice of population samples for conservation (when creating reserves or cryogenic cell banks and DNA) is determined by the uniqueness of their genotype. According to Yu.A. Yanbaeva and other authors [9], namely, the habitats with the greatest diversity (the number of genotypes) are apparently of primary interest when selecting objects for preserving the gene pool in situ, as well as when selecting samples to create an ex situ collection of clones.
Materials and research methods
Five coenopopulations of a rare plant species Adonis wolgensis Stev. located on the territory of Pavlodar, Kostanay and Akmola regions of the Republic of Kazakhstan (Table 1) were selected as the objects of research.
Table 1 Characteristics of coenopopulations (CP) of A. wolgensis
|
No. of CP |
Location of CP |
Habitat |
|
Awl |
Pavlodar region, near Ekibastuz city, N51.66494°, W75.28173°, h=412 m above the sea level. |
Inter-hill lowering, feather grass and sheep's fescue steppe |
|
Aw2 |
Kostanay region, near Ozernoe village, Novonezhenskoye forestry, sq. 21, N52.43971°, W64.09279°, h=213 m above the sea level |
Secondary psammophyte steppe in place of the old fire |
|
Aw3 |
Pavlodar region, near Bayanaul village, N50.2209°, W75.8009°, h=406 m above the sea level |
Foot of the slope, sheep's fescue and sheep's fescue steppe covered with bushes |
|
Aw4 |
Akmola region, near Katarkol village, N52.93287°, W70.49210°, h=431 m above the sea level |
Edge of the birch and pine forest |
|
Aw5 |
Kostanay region, near Scherbakovo village, N53.20453°, W64.21550°, h=193 m above the sea level |
Sparse pine forest on the sands |
In each of the noted populations, leaves were collected from 30 randomly selected plants at a distance of 30 to 50 m from each other. Plants are characterized by the accumulation a large number of secondarymetabolites in certain organs, which have a significant negative effect on isolation procedures, and may later be inhibitors of PCR reactions. The polyphenols, presenting in many plants, enter into oxidation reactions during the homogenization of tissues and get covalently bound to proteins and nucleic acids, and the DNA sediment turns brown. Such DNA samples are unsuitable for PCR. Phenols can be bound and their interactions with nucleic acids can be prevented using polyvinylpyrrolidone (PVP) or polyvinylpolypyrrolidone (PVPP) contained in the extraction buffer of polymers [ɪ0].
A modified technique was used to isolate DNA from the dried leaves of A. wolgensis. The cationic detergent in this procedure was ammonium cetyltrimethyl ammonium bromide (CTAB). A modification of the standard procedure was that β-mercaptoethanol was removed from the isolation protocol and polyvinylpolypyrrolidone (PVPP) was added [ɪɪ].
Detection of genetic polymorphism of DNA of A. wolgensis was performed by the ISSR method of analyzing DNA polymorphism using PCR. For the studied species, there were selected the most effective primers giving reproducible results — three dinucleotide (M1 (AC) 8CG, M3 (AC) 8CT, M27 (GA) 8C) and two trinucleotide ISSR primers (X11 (AGC) 6G, ISSR4 (ACG) 7G) [12]. Amplification products were separated by agarose gel electrophoresis and photographed in transmitted ultraviolet light. To determine the length of DNA fragments, the molecular weight marker (100 bp + 1.2 + 1.5 + 2 + 3 КЬ DNA Ladder; OOO SibEnzyme-M, Moscow) was used; the fragment lengths were determined using the Quantity One program (Bio Rad, USA). To verify the accuracy of the obtained DNA spectra, the experiment was repeated at least three times.
In order to quantify polymorphism and determine the level of divergence between the studied CP, the obtained data were presented as a matrix of binary data in which the presence or absence of identical sized fragments in the ISSR spectra was considered, respectively, as state 1 or 0. Only DNA fragments reproducible in experiments were taken into consideration, intensity of polymorphism was not taken into account.
A computer analysis of the obtained data was performed using the POPGENE 1.31 program and the specialized macro GenAlEx6 for MS-Excel with the definition of: part of polymorphic loci (P95), absolute number of alleles (na), effective number of alleles (ne), expected heterozygosity (HE) [13]; Shannon Information Index (I) [14]. To describe the genetic structure of the population, the following parameters were used: the expected proportion of heterozygous genotypes (HT) in the entire population as a measure of total gene diversity; the expected proportion of heterozygous genotypes (HS) in the subpopulation as a measure of its intrapopulation diversity; the proportion of interpopulation genetic diversity in total diversity, or the index of population division (GST). The level of intrapopulation diversity is estimated through indicators: the average number of morphs (µ) and the proportion of rare morphs (h) [15].
Based on the matrix of the binary data using the computer programs TREECON 1.3b and POPGENE 1.31 matrix of genetic differences was calculated. Based on the obtained matrix by the unweighted paired- group method (UPGMA — unweighed pair-group method using arithmetic average), dendrograms reflecting the degree of similarity of the studied cenopopulations by ISSR-spectra were constructed.
Research results and discussion
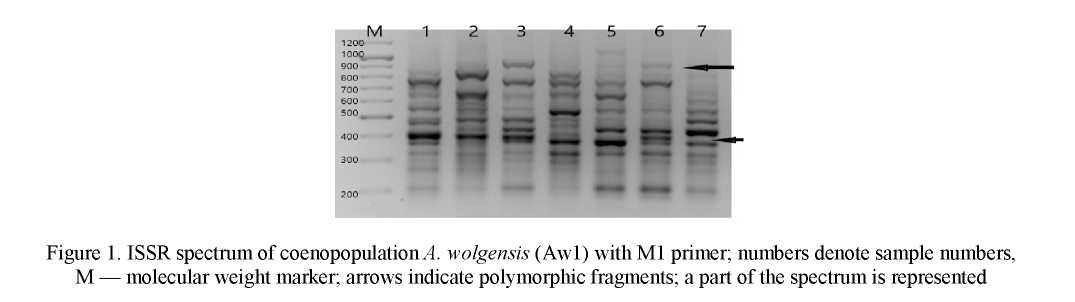
When analyzing DNA fragments amplified as a result of PCR, 81 amplified DNA fragments were detected in 5 studied cenopopulations of A. wolgensis, among them 71 (P95=0,877) were polymorphic. The number of amplified DNA fragments in the total sample of A. wolgensis varied, depending on the primer, from 9 (M3) to 20 (M1, M27) (Fig. 1). On average, within ISSR-analysis in this species one primer initiated the synthesis of 16.2 DNA fragments. The number of polymorphic DNA fragments in the total sample of plants varied from 5 to 20, and their sizes did from 210 to 1300 bp.
The proportion of polymorphic loci in the total sample of A. wolgensis, depending on the ISSR primer, ranged from 0.555 (M3) to 1.000 (M27) and averaged 0.877. The number of polymorphic DNA fragments ranged from 67 for Aw1, Aw2, Aw4 to 72 for Aw3.
The most common measure of genetic variation in a population is heterozygosity. Theoretically, heterozygosity is distributed within a population in a rather complicated way, and heterozygosity rates are not directly dependent on the number of alleles [16]. The expected heterozygosity for the loci in the total sample of A. wolgensis was 0.285. In A. wolgensis coenopopulations this value varied from 0.273 in Aw2 to 0.300 in Aw1 (Table 2). The assessment of reliability when comparing the proportions of polymorphic loci and the expected heterozygosity in pairs between the studied cenopopulations according to Fisher criterion is given in Table 3.
Table 2 Indicators of genetic diversity of A. wolgensis cenopopulations based on polymorphism of ISSR marker
|
Aw 1 |
Aw2 |
Aw3 |
Aw4 |
Aw5 |
Per general population |
|
|
He |
0.300 (0.020) |
0.273 (0.019) |
0.292 (0.017) |
0.284 (0.019) |
0.278 (0.018) |
0.285 (0.019) |
|
nα |
1.828 (0.381) |
1.803 (0.401) |
1.877 (0.331) |
1.840 (0.369) |
1.827 (0.381) |
1.926 (0.264) |
|
Пе |
1.516 (0.357) |
1.455 (0.337) |
1.476 (0.301) |
1.472 (0.169) |
1.456 (0.315) |
1.550 (0.296) |
|
P95 |
0.859 |
0.838 |
0.888 |
0.861 |
0.838 |
0.877 |
|
R |
0 |
0 |
0 |
0 |
1 |
1 |
|
μ |
1.718 (0.008) |
1.672 (0.008) |
1.727 (0.008) |
1.692 (0.008) |
1.701 (0.008) |
1.698 (0.008) |
|
h |
0.141 (0.004) |
0.164 (0.004) |
0.136 (0.004) |
0.154 (0.004) |
0.149 (0.004) |
0.144 (0.004) |
|
I |
0.446 |
0.414 |
0.445 |
0.430 |
0.423 |
0.492 |
Note. P95 — the frequency of polymorphic loci; HE — the expected heterozygosity; na — absolute number of alleles per locus; ne — effective number of alleles per locus; in brackets standard deviations for all the above parameters are given; R — rare fragments.
By comparing the reliability of the difference of these parameters, it can be concluded that the studied coenopopulations of A. wolgensis have similar values of the proportion of polymorphic loci and the expected heterozygosity, since the difference of these indicators between coenopopulations is insignificant (Table 3).
Table 3
Estimation of the significance of the difference when comparing the indicators P95 and HE according to the Fisher criterion between A. wolgensis coenopopulations
|
CP |
Aw 1 |
Aw2 |
Aw3 |
Aw4 |
Aw5 |
|
Aw 1 |
- |
0.463 |
0.385 |
0.497 |
0.498 |
|
Aw2 |
0.791 |
- |
0.857 |
0.467 |
0.385 |
|
Aw3 |
0.168 |
0.646 |
- |
0 |
0.456 |
|
Aw4 |
0.605 |
0.799 |
0.388 |
- |
0.574 |
|
Aw5 |
0.471 |
0.646 |
0.509 |
0.838 |
- |
Note. Above the diagonal there is the difference in the proportion of polymorphic loci (P95), under the diagonal there is the expected heterozygosity (HE); if F exp. is more than 1.96, the result is reliable.
The effective number of alleles (ne) is a function of the proportion of polymorphic loci, the number of alleles per locus and the evenness of allele frequencies, and is, thus, a measure of the genetic diversity of a population or species. The effective number of alleles estimates the value of homozygosity and represents the number of alleles, with the same frequency of which in the population, the expected heterozygosity will be equal to the actual [17].
The absolute number of alleles per locus (na) (in this case per DNA fragment) per total population was 1.926. This parameter is the highest in the Aw3 coenopulation (na = 1.877), in the Aw5 coenopulation it is the smallest (na = 1.827). The effective number of alleles per locus (ne) per total sample is 1.550. The highest value of ne is found in the Aw1 population (ne = 1.516), and the lowest value is noted in the Aw2 population (ne = 1.455). The Shannon Information Index [14] also revealed the highest diversity in the Aw1 population (I = 0.446), and the least one in the Aw2 population (I = 0.414). In the studied coenopopulations of A. wolgensis, only one rare fragment was found in the Aw5 (Table 2).
Indicators of intrapopulation diversity are of a great significance in characterizing genetic diversity. The indicator of intrapopulation diversity (μ) is proposed by L.A. Zhivotovsky [15]. The initial data for this parameter are the frequencies of morphs (in our case, the frequencies of the ISSR-markers). The more evenly the frequency distribution of the morph is, the more this indicator is close to the maximum. The maximum is equal to the number of morphs represented in the population, in the case of using ISSR-markers it is 2. When analyzing the intrapopulation diversity of A. wolgensis using the μ indicator, it was found that out of the 5 studied coenopopulations, coenopopulation Aw2 (µ = 1.672) is more evenly distributed, and the smallest (μ = 1.727) is the coenopopulation Aw3 (Table 2).
In comparison with μ, the proportion of rare morphs (h) presents new information about the nature of intrapopulation diversity. While μ gives an estimate of the degree of diversity of the population, the indicator h estimates the structure of this diversity [15]. With the dominant character of inheritance of ISSR-markers, these values show the proportion of null alleles. According to L.A. Zhivotovsky [15], with values of h > 0.3 in the genetic structure of populations, the proportion of recessive homozygotes is increased. Thus, the smaller the h value of the threshold 0.3 is, the more balanced the structure of diversity the studied populations is characterized by. For all the studied cenopopulations, the indicator h has values less than 0.3, which may indicate a smaller proportion of null alleles in the structure of intrapopulation diversity. The cenopulation Aw2 is characterized by the most balanced structure of diversity (h = 0.141), and the population Aw2 is characterized by the least balanced (h = 0.164) (Table 2).
M. Ney [13] used the heterozygosity value to describe the genetic structure of populations (in this case, coenopopulations) and called it gene diversity. On its basis, he introduced the concept of total gene diversity in the total sample (HT), which represents heterozygosity for the entire sample, the average selective gene diversity across all loci (HS), this is the average heterozygosity by population, and the division index of population (GST). The total gene diversity in the total sample (HT) of A. wolgensis was 0.333, the average genetic sample diversity (HS) in the co-populations of A. wolgensis is 0.289. Thus, the average heterozygosity in the coenopopulation of A. wolgensis is lower than in the total sample. The lowest rates of the proportion of heterozygous genotypes were detected using primer M3. The expected heterozygosity determined by it is 0.188, and the highest values of the proportion of heterozygous genotypes are observed in primer M27 — 0.378 (Table 4).
The studied coenopopulations of A. wolgensis are poorly differentiated, the largest part of the entire observed genetic diversity is concentrated within populations (86.91 %), and the proportion of the interpopulation variability is 13.14 % (Table 4).
Table 4 Genetic structure and differentiation of five coenopopulations of A. wolgensis
|
ISSR- primer |
Ht |
Hs |
gst |
|
M1 |
0.383(0.015) |
0.334(0.012) |
0.128 |
|
ISSR4 |
0.278(0.006) |
0.254(0.007) |
0.085 |
|
X11 |
0.322(0.027) |
0.255(0.019) |
0.207 |
|
M3 |
0.195 (0.036) |
0.188 (0.034) |
0.037 |
|
M27 |
0.378(0.013) |
0.331(0.010) |
0.123 |
|
Total sample |
0.333 (0.020) |
0.289 (0.015) |
0.131 |
Note. HT is the expected proportion of heterozygous genotypes as a measure of the total gene diversity in the entire population; HS is the expected share of heterozygous genotypes in a single population, as a measure of its intrapopulation diversity or the average selective gene diversity across all loci; GST is the proportion of interpopulation genetic diversity in total diversity, or an indicator of population subdivision; standard deviations are given in brackets.
Based on the obtained data on the ISSR analysis of A. wolgensis DNA polymorphism, the genetic relationships between the studied populations were determined, a matrix of binary features was compiled, and matrices of genetic differences were calculated. Based on the obtained matrix, a cluster analysis was carried out using the unweighted paired-group method (UPGMA) and the dendrogram reflecting the degree of similarity of the studied population groups in the ISSR spectra was constructed (Fig. 2).
0.3 0.2 0.1
Popl
Pop2
Pop4
Pop5
Pop3
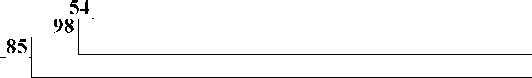
Figure 2. UPGMA-dendrogram of genetic similarity of 5 coenopopulations of A. wolgensis, constructed on the basis of polymorphism of ISSR-markers; the scale above is for genetic distance;
the bootstrap values (in %) are indicated, Pop1 — Aw1, Pop2 — Aw2, Pop3 — Aw3, Pop4 — Aw4, Pop5 — Aw5
The Treecon 3.1 computer program was used to construct the dendrograms with the use of 100 bootstrap replicas. Branch nodes have high support (bootstrap index > 50 %). The shortest genetic distance [15] is noted between Aw2 and Aw4 (D = 0.056), and the longest is between Aw3 and Aw2 (Table 5).
Table 5
Genetic distance between coenopopulations of A. wolgensis
|
Aw 1 |
Aw2 |
Aw3 |
Aw4 |
Aw5 |
|
|
Aw1 |
– |
||||
|
Aw2 |
0.063 |
– |
|||
|
Aw3 |
0.116 |
0.127 |
– |
||
|
Aw4 |
0.061 |
0.056 |
0.085 |
– |
|
|
Aw5 |
0.096 |
0.098 |
0.059 |
0.094 |
– |
Based on the obtained data from Table 5, it can be concluded that all coenopopulations are characterized by a rather low genetic distance between them. We assume that the selected coenopopulations are the part of a single local population of A. wolgensis in the territory of Northern Kazakhstan.
Conclusion
Thus, based on the ISSR analysis of genetic polymorphism of the five coenopopulations of Adonis wolgensis in the North of Kazakhstan, we can conclude that the studied coenopopulations of this species are characterized by high rates of genetic diversity and low genetic subdivision of coenopopulations. In the coenopopulations there are practically no unique ISSR markers. The proportion of polymorphic loci (P95) varies from 0.555 (M3) to 1.000 (M27) and averages 0.877; the expected heterozygosity (HE) was 0.285, in coenopopulations this value varied from 0.273 in Aw2 to 0.300 in Aw1. The level of interpopulation differentiation in A. wolgensis was (GST = 0.131). As a result of the study, on the basis of a molecular genetic analysis of coenopopulations of a rare plant species, new fundamental knowledge about genetic diversity and the genetic structure of the studied coenopopulations was obtained for the first time.
This work was carried out within the framework of the grant financing project of the Ministry of Education and Science of the Republic of Kazakhstan for 2018–2020. № AR05132458 «Molecular genetic gene pool analysis of rare plant species population in Northern Kazakhstan», state registration number 0118RK00404.
References
- Lebedeva, N.V., Drozdov, N.N., & Krivolutskii, D.A. (1999). Bioraznoobrazie i metody eho otsenki [Biodiversity and its assessment methods]. Moscow: MSU Publ. [in Russian].
- Zviagina, N.S., & Dorogina, O.V. (2013). Heneticheskaia differentsiatsiia altaesaianskoho endemika Hedysarum theinum Krasnob. (Fabaceae) po dannym mezhmikrosatellitnoho analiza henomnoi DNK [Genetic differentiation of the Altayayan endemic Hedysarum theinum Krasnob. (Fabaceae) according to the intermicrosatellite analysis of genomic DNA]. Henetika — Genetics, 49, 10, 1183–1189 [in Russian].
- Gostimskii, S.A., Kokaeva, Z.G., & Konovalov, F.A. (2005). Izuchenie orhanizatsii i izmenchivosti henoma rastenii s pomoshchiu molekuliarnykh markerov [The study of the organization and variability of the plant genome using molecular markers]. Genetika — Genetics, 41, 4, 480–490 [in Russian].
- Seliutina, I.Yu., Konichenko, E.S., & Dorogina, O.V. (2014). Vozmozhnosti ispolzovaniia ISSR-markerov dlia vyiavleniia heneticheskoi differentsiatsii populiatsii redkoho vida Astragalus sericeocanus (Fabaceae) [The possibility of using ISSR-markers to identify genetic differentiation of populations of a rare species Astragalus sericeocanus (Fabaceae)]. Rastitelnyi mir aziatskoi Rossii — Plant World of Asiatic Russia, 4, 3–8 [in Russian].
- Manninen, O., Kalendar, R., Robinson, J., & Schulman, A.X. (2000). Application of BARE-1 retrotransposon markers to the mapping of a major resistance gene for net blotch in barley. Mol. Genet. And Genom. 26, 325–334.
- Boronnikova, S.V. (2013). Molekuliarno-heneticheskii analiz i otsenka sostoianiia henofondov resursnykh vidov rastenii Permskoho kraia [Molecular genetic analysis and assessment of the state of gene pools of resource plant species of the Perm region]. Perm: Permskii hosudarstvennyi natsionalnyi universitet [in Russian].
- Krasnaia kniha Kazakhstana. T. 2. Rasteniia [The red book of Kazakhstan. Vol. 2. Plants]. (2013). (2nd ed., revised and supplemented). Astana: ArtPrintXXI JSC [in Russian].
- Poshkurlat, A.P. (2000). Rod horitsvet — Adonis L. Sistematika, rasprostranenie, biolohiia [The Genus Adonis L. — pheasant's eye. Systematic, distribution, biology]. Moscow: Nauka; MAIK «Nauka Interperiodika» [in Russian].
- Yanbaev, Yu.A., Bairamgulov, N.R., & Redkina, N.N. et al. (2007). Populiatsionnaia struktura i printsipy sokhraneniia henofonda rodioly iremelskoi na Yuzhnom Urale [Population structure and principles of the preservation of the Rhodiola iremelskaya gene pool in the Southern Urals]. Ufa [in Russian].
- Nechaeva, Yu.S., et al. (2011). Optimizatsiia metodiki vydeleniia DNK nekotorykh khvoinykh vidov rastenii Permskoho kraia [Optimization of the DNA extraction technique of some coniferous species of plants in the Perm region]. Proceedings from The synthesis of knowledge in the natural sciences. The future mine: projects, technologies, equipment: Materialy Mezhdunarodnoi konferentsii — Materials of the international conference. (pp. 278–282). Perm [in Russian].
- Rogers, S.O., & Bendich, A.J. (1985). Extraction of DNA from milligram amounts of fresh, herbarium and mummified plant tissues. Plant Molecular Biology. 1, 19, 69–76.
- Beltiukova, N.N., Prishnivskaia, Ya.V., & Tomilova Yu.O. et al. (2018). Podbor effektivnykh ISSR-praimerov dlia redkoho vida Adonis wolgensis Stev. [Selection of effective ISSR primers for the rare species Adonis wolgensis Stev]. Sovremennye nauchnye issledovaniia i razrabotki — Modern scientific research and development, 8(25), 26–29 [in Russian].
- Nei, M. (1987). Molecular evolutionary genetics. New York: Columbia Univ. press.
- Lewontin, R.C. (1972). The apportioment of human diversity. EV. Biol. 6, 381–398.
- Zhivotovskii, L. A. (1980). Pokazatel vnutripopuliatsionnoho raznoobraziia [Indicator of intrapopulation diversity]. Zhurnal obshchei biolohii — Journal of General biology, 41, 6, 828–836 [in Russian].
- Khedrik, F. (2003). Mir biolohii: henetika populiatsii [Biology World: Population Genetics]. Moscow: Tekhnosfera [in Russian].
- Sheremeteva, I.N. & Chelomina, G.N. (2003). Otsenka heneticheskoho raznoobraziia ostrovnykh i materikovykh populiatsii dalnevostochnoi polevki Microtus fortis (Rodentia, Sricetidae): dannye RAPD-PCR analiza [Assessment of the genetic diversity of the island and continental populations of the Far Eastern vole Microtus fortis (Rodentia, Gricetidae): RAPD-PCR analysis data]. Biolohicheskie issledovaniia na ostrovakh severnoi chasti Tikhoho okeana — Biological research on the islands of the North Pacific, 9, 1–18 [in Russian].