Abstract. This paper investigates the core reasons for the occurrence of corruption in the developing countries. Author applies the OLS regression model in order to determine the factors that influence on the corruption level. In doing so, the two models are identified, namely economic and political ones that explain the corruption. The findings from combination of the two models indicate that higher levels of political stability, freedom of press, GDP per capital are needed in order to tackle the corruption. Also, there should be regular transition of political leaders in order to reduce the corruption level.
Introduction
Nowadays corruption has become the problem of the universal magnitude. Countries around the world are adopting the various strategies in order to address this issue. The World Bank identifies corruption as the “is the abuse of public or corporate office for private gain” [1]. Other international bodies also define corruption in the similar way. For instance, OECD identifies “Corruption is active or passive misuse of the powers of public officials (appointed or elected) for private financial or other benefits” [2]. While, United Nations defines it in the following way: “Corruption is the abuse of public office for personal gain, directly or indirectly”[3].
Starting from the 1995 the prominent NGO Transparency International has began the publication of its annual report on the level of corruption around the world. The Corruption Perception Index developed by this NGO serves as on one of the reputable indicators of determining the level of corruption in the particular country. The governments around the world try adopting strategies and policies in combating the corruption with the hope that efforts of the country will be reflected in CPI annual rankings.
The growing concerns over the spread of corruption around the world raise the questions about the reasons for the emergence of this phenomenon. In this paper, the focus will be given for the developing countries. In particular, the identification of the reasons for the occurrences of corruption in the developing nations.
Research Question
In this study the proposed research questions is: What factors influence on the level of corruption in the developing countries?
I have used the paper “Determinants of corruption in developing countries” by Shabbir and Anwar as the framework for my study [4]. Generally, scholars used the crosssectional dataset for 41 developing counties for the year 2007 in order to identify key variables that influence on the high level of the corruption. The methodology in my study replicates the Shabbir and Anwar’s work, with the difference that I have collected dataset for 75 developing countries, for the year 2017 and have additionally included into the model 3 independent variables that were not present in the research paper of the scholars. I will present the methodology for my paper more specifically in the next section.
Methodology
I have collected the cross-sectional dataset for the year 2017 in order to make comparison of developing states. The year 2017 was chosen due to the availability of the most recent and detailed data on that period. Developing countries are chosen on the basis of World Bank classification on the income level. I have chosen to analyze the countries, which are classified by the World Bank as low-income, lower-middle income and upper-middle income economies. All these countries are classified as developing nations since they have potential of moving into the last category of the high-income economies. Altogether, the initial set of developing countries constituted 138 countries. However, during the collection of data, I found that many countries were missing the information on the variables of interest. Thus, I have dropped the countries, which were missing the many pieces of information. As a result, final dataset includes 75 developing countries.
Variables
In this study the dependent variable is the level of corruption, which is operationalized through the Corruption Perception Index (CPI). This index is elaborated by the Transparency International on the yearly basis. Generally, CPI represents the result of the surveys, which were conducted among the expert community. Various international organizations carry out the surveys, including the Freedom House, Economic Intelligence Unit, United Nations, etc. Consequently, the results of surveys are combined by the Transparency International and presented to the public. According to the Transparency International’s definition CPI ranges on the scale from 0 to 100, where 0 is highly corrupt and 100 is very clean. However, similar to Shabbir and Anwar, 2008 I have reversed the data on CPI scale for the purposes of the convenient interpretation. In this study the CPI score of 0 implies very clean, whereas 100 indicates the highly corrupt.
DESCRIPTIVE STATISTICS
|
Variable |
Obs |
Mean |
Std.Dev. |
Min |
Max |
|
Corruption |
75 |
65.667 |
9.794 |
39 |
85 |
|
EcFreedom |
74 |
57.815 |
7.807 |
33.9 |
76 |
|
Globalisat~n |
75 |
60.587 |
10.544 |
38.2 |
81.4 |
|
Literacyrate |
75 |
.835 |
.18 |
.223 |
1 |
|
DevelopLevel |
75 |
4.465 |
3.471 |
.214 |
14.871 |
|
IncomeDist~n |
71 |
60.849 |
7.962 |
37 |
75 |
|
Pressfreedom |
75 |
60.369 |
14.208 |
15.81 |
88.07 |
|
PolitStabi~y |
75 |
-.532 |
.8 |
-2.8 |
1.02 |
|
Democarcy |
75 |
5.033 |
1.656 |
1.5 |
8.22 |
|
Variable |
Obs |
Mean |
Std.Dev. |
Min |
Max |
|
LeaderYears |
75 |
8.013 |
8.78 |
1 |
38 |
|
PartyYears |
69 |
14.377 |
15.911 |
1 |
68 |
|
Islam |
75 |
.373 |
.487 |
0 |
1 |
|
Catholicism |
75 |
.32 |
.47 |
0 |
1 |
|
Protestant~m |
75 |
.08 |
.273 |
0 |
1 |
|
Orthodox |
75 |
.133 |
.342 |
0 |
1 |
|
Hinduism |
75 |
.027 |
.162 |
0 |
1 |
|
Buddism |
75 |
.067 |
.251 |
0 |
1 |
|
The explanatory variables |
have been determinants of corruption. |
||||
|
divided into the two different namely, economic and |
categories, (1) The economic model of determining political corruption: |
||||
Corruption = B0 + B1(EcFreedom) + B2(Globalisation) + B3(Literacyrate) +
B4(DevelopLevel) + B5(IncomeDistribution) + E
Description of independent variables:
EcFreedom – is the Economic freedom index, which combines 12 types of freedoms, including business freedom, labor freedom, monetary freedom, trade freedom, financial freedom and others. The index is elaborated by the Heritage foundation. The data on the Economic freedom index was collected from the online platform of the Heritage foundation. The score ranges between 0 and 100, where 0 represents minimum freedom, while 100 indicates maximum level of freedom.
Globalisation – is the index developed by KOF Swiss Economic Institute that measures economic, social and political aspects of global integration. The data on the globalization index was collected from the website of KOF Swiss Economic Institute. The scale ranges from 1 to 100, where 1 represents the minimum global integration and 100 indicates maximum level of integration.
Literacy rate – demonstrates the share of population, who are able to read and write. Ranges from 0% to 100%. I have collected the data on the literacy rate from the World Bank development indicators database. For the convenience purpose, I have used the scale from 0 to 1 with the decimal points indicating the proportion of literate population.
Development level – represents the GDP income per capita adjusted for inflation (constant, in US dollars). I have collected the data on the GDP per capita from the World Bank development indicators database. For the convenience purpose I have transformed the data into the thousands of US dollars.
Income distribution – is measured by the GINI index. The GINI score ranges from 0 to 100, where 0 represents perfect economic equality and 100 perfect economic inequality. I have collected the data on GINI index from the World Bank development indicators database as well as the Globaleconomy.com online database. Similar to Shabbir and Anwar, 2008 I have reversed the data on GINI scale so that 0 implies perfect inequality and 100 indicates perfect equality.
(2) The political model of determining corruption:
Corruption = B0 + B1(PressFreedom) + B2(Democracy) + B3(Islam) +B4(Catholicism) + B5(Protestantism) + B6(Orthodox) + B17(Hinduism) B8(LeaderYears) + B9(PartyYears) + B10(PolitStability) + E
Description of independent variables:
Press freedom – is the index that is elaborated by the international NGO Reporters Without Borders. This index measures to what extent journalists around the world are free to express their opinions regarding various issues. The scale of index ranges from 0 to 100, where 0 represents absolute freedom, while 100 absence of freedom. I have collected the data on press freedom index from the website of Reporters Without Borders NGO. Similar to Shabbir and Anwar, 2008 I have reversed the data on Press freedom scale so that 0 indicates absence of freedom, while 100 implies absolute freedom
Democracy – is the degree of democracy index that is elaborated by the Economist Intelligence Unit. This index combines and evaluates five elements, namely, electoral processes, functioning of government, political participation, political culture, civil liberties. The scale of degree of democracy index ranges from the 0 to 10, where 0 is a full autocracy, while 10 is a full democracy. I have collected the data on degree of democracy from the website of Economist Intelligence Unit.
Islam, Catholicism, Protestantism, Orthodox, Hinduism – are dummy variables, which are taking the value of 1 if the majority of population in particular country is affiliated with this religion, and 0 otherwise. The data on the religious affiliation has been collected from the Central Intelligence Agency’s World Factbook database.
Apart from described independent variables I have included into the model 3 new independent variables. These variables were not present in the model of Shabbir and Anwar, 2008.
LeaderYears – is the variable that describes how many consecutive years in power stayed the highest political person of the particular country prior to the year 2017. It is measured in the number of years. Depending on the political structure of the country, the different political positions were considered as the unit of analysis. For the Presidential Republics – Presidents, for Parliamentary Republics – Prime Ministers, for Monarchies – Kings, were considered as the unit of analysis. For Federation depending on the strength of executive power the Prime-Ministers or Presidents were considered. I have counted how many consecutive years the particular leader was ruling the county prior to the 2017. The relevant data on this matter were collected through the searching open sources, which include Forbes, Reuters, The Guardian, The UN facts and figures, and other sources.
Generally the intuition for collecting this data is the hypothesis that there is a positive correlation between the period leader stays in power and the perception of corruption. In other words, I expect that the longer the country leader stays in power, the higher is the perception of corruption in the country. This is because long presidential tenures are associated with the political stagnation and consequent practices of corruption.
PartyYears – is the variable that represents how many consecutive years the particular political party was dominating the seats in the parliament prior to the year 2017. It is measured in the number of years. Here it should be noted that due to the fact that some countries in the sample were monarchies without the proper parliamentary systems, no data can be filled for these countries. Consequently, it has resulted in the missing values for the 6 countries. The relevant data on this matter were collected through the searching open sources, which include Forbes, Reuters, The Guardian, The UN facts and figures, and other sources.
This data was collected in order to test hypothesis about positive correlation between the longevity of ruling political party and perception of the corruption. In other words, I suppose that the longer political party dominates the parliament the higher is the perception of the corruption in the country.
PolitStability – is the political stability index that is elaborated by the World Bank. This index measures the perception that government will be overthrown or destabilized. The scale of index ranges from the -2,5 to 2,5, where -2,5 represents weak state, while 2,5 represents strong state. The data on political stability index has been collected from the World Governance Indicators.
Findings
All the regressions in the study are conducted through using the robust standard errors technique. This was done in order to address the heteroscedasticity issue. By doing regression on corruption and its economic determinants I have acquired the following results: As it can be noticed from the table above the coefficients
Corruption Corruption Corruption
|
(1) |
(2) |
(3) |
|
|
Economic Freedom |
-0.332 |
-0.339 |
-0.196 |
|
(1.99)* |
(2.04)** |
(0.93) |
|
|
Globalisation |
-0.506 |
-0.539 |
-0.534 |
|
(4.02)*** |
(4.66)*** |
(3.76)*** |
|
|
Literacy rate |
11.570 |
10.297 |
11.418 |
|
(1.89)* |
(1.77)* |
(2.06)** |
|
|
Development Level |
-0.220 |
- |
-0.437 |
|
(0.70) |
(1.25) |
||
|
Income Distribution |
0.232 |
0.255 |
- |
|
(1.63) |
(1.77)* |
||
|
_cons |
92.755 |
93.903 |
101.606 |
|
(8.81)*** |
(9.38)*** |
(11.96)*** |
|
|
R2 |
0.47 |
0.47 |
0.44 |
|
N |
70 |
70 |
74 |
Table 1. Economic determinants of corruption
Note: Value in parenthesis is t-statistics. * p<0.10; ** p<0.05; *** p<0.01
on Literacy rate and Globalization are consistently significant across the three types of models. Generally this implies that an increase in the level of country’s globalization is associated with the decrease in the level of corruption. Going further, an increase in the literacy rate is associated with the increase in the corruption level. Shabbir and Anwar in their paper explain this fact in the following way. In the developing countries the public sector often times is the only source of employment. In order to get
employed individuals need to demonstrate their education qualifications. Consequently higher level of education leads to the corruption. The coefficient on economic freedom is negative and statistically significant in two models. This implies that an increase in the level of economic freedom is associated with the decrease in the level of corruption. Interestingly, the coefficient on level of development of the country
is not statistically significant in all three models. This indicates that GDP per capita does not determine the level of corruption. The coefficient on income distribution is only significant at 10% level in one of the models.
In the model with the political determinants of corruption the outcomes are presented in the following way:
As it can be noticed from the table above, four independent variables are consistently significant across all the models. It worth describing them in more detail. The coefficient on democracy has the negative sign and implies that the higher level of
democracy is expected to reduce the level of corruption. The coefficient on political stability has negative sign and implies that the more stable is the country the less is the level of corruption. Most interestingly, the coefficient on the variable years leader in
QUARTERLY ANALYTICAL REVIEW
1 (77)/2020
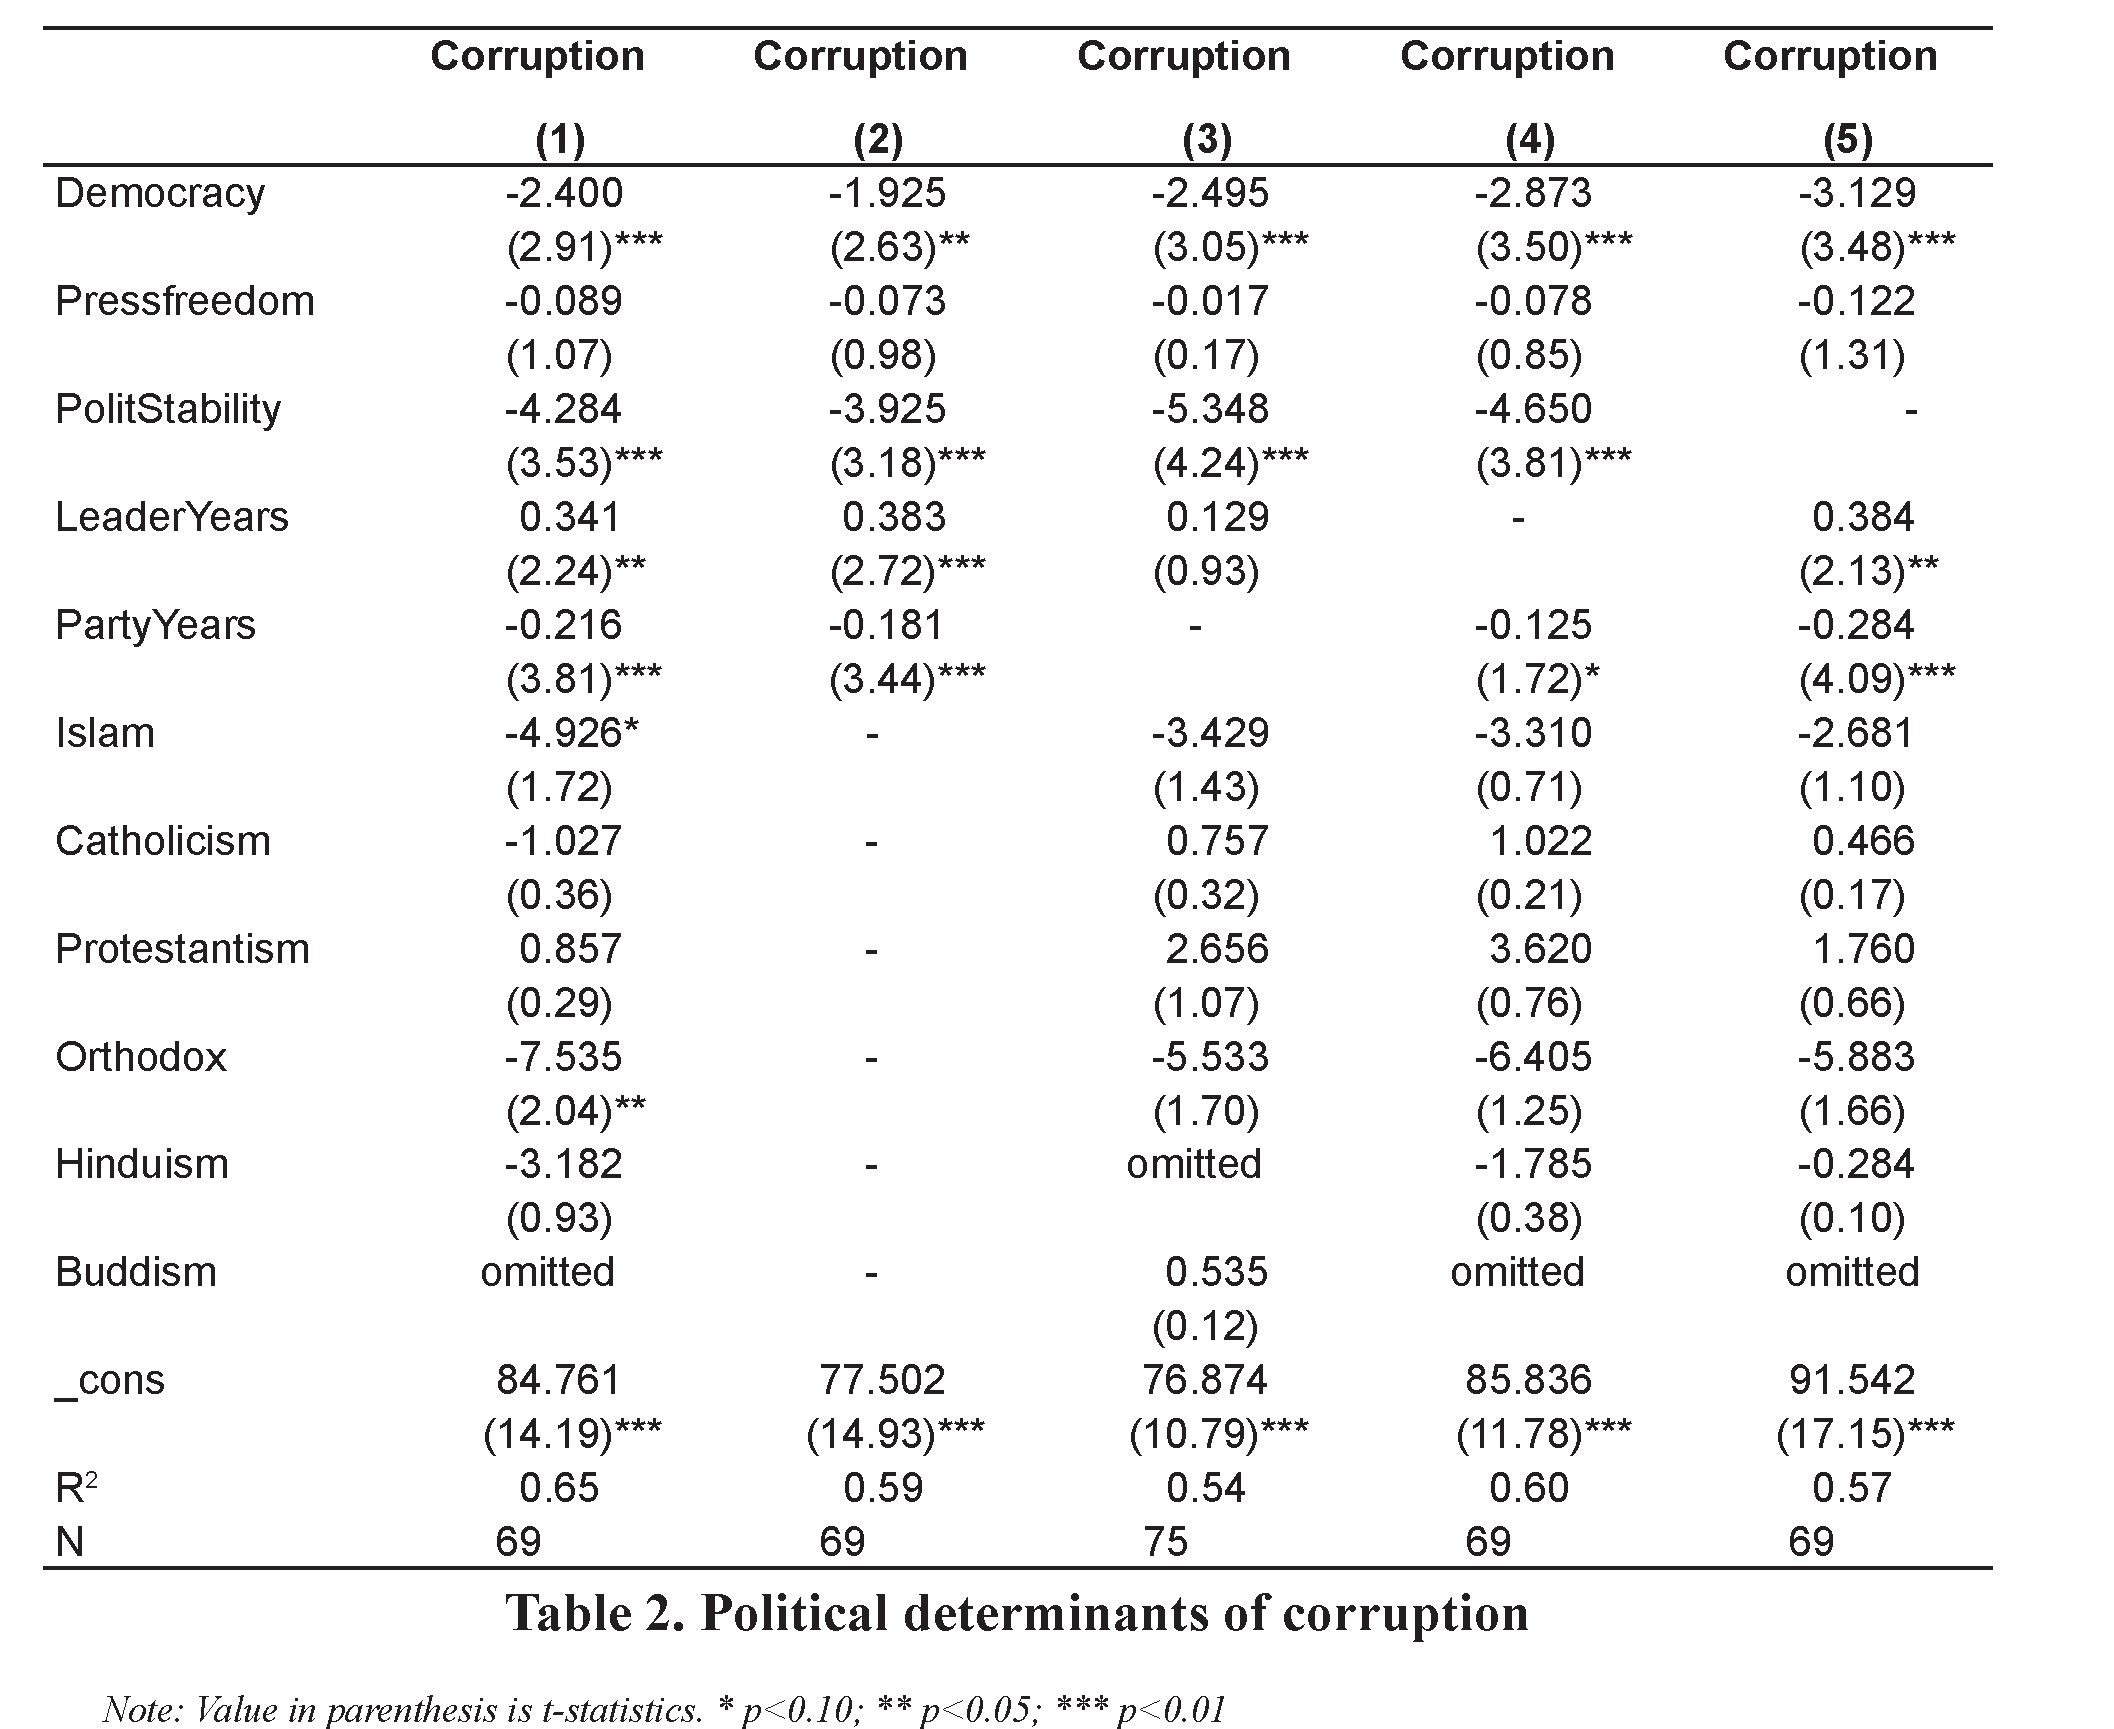
power has the positive sign. This implies that the longer the political leader of the country stays in power the higher is the level of corruption in that particular country. In other words, long tenure dictatorships are expected to increase the corruption level in the country. Furthermore, the coefficient on the years political party dominates the parliament has the negative sign. This implies that the longer party dominates the seats in parliament the lower is the corruption level in the country. This could be explained by the fact that parties that in the long rung develop effective anti-corruption strategies. The coefficients on the variables of religions as well as freedom of press are not statistically significant across majority of models. This implies that religion does not have the effect of the level of corruption in the country, the same is true for the degree for the freedom of press.
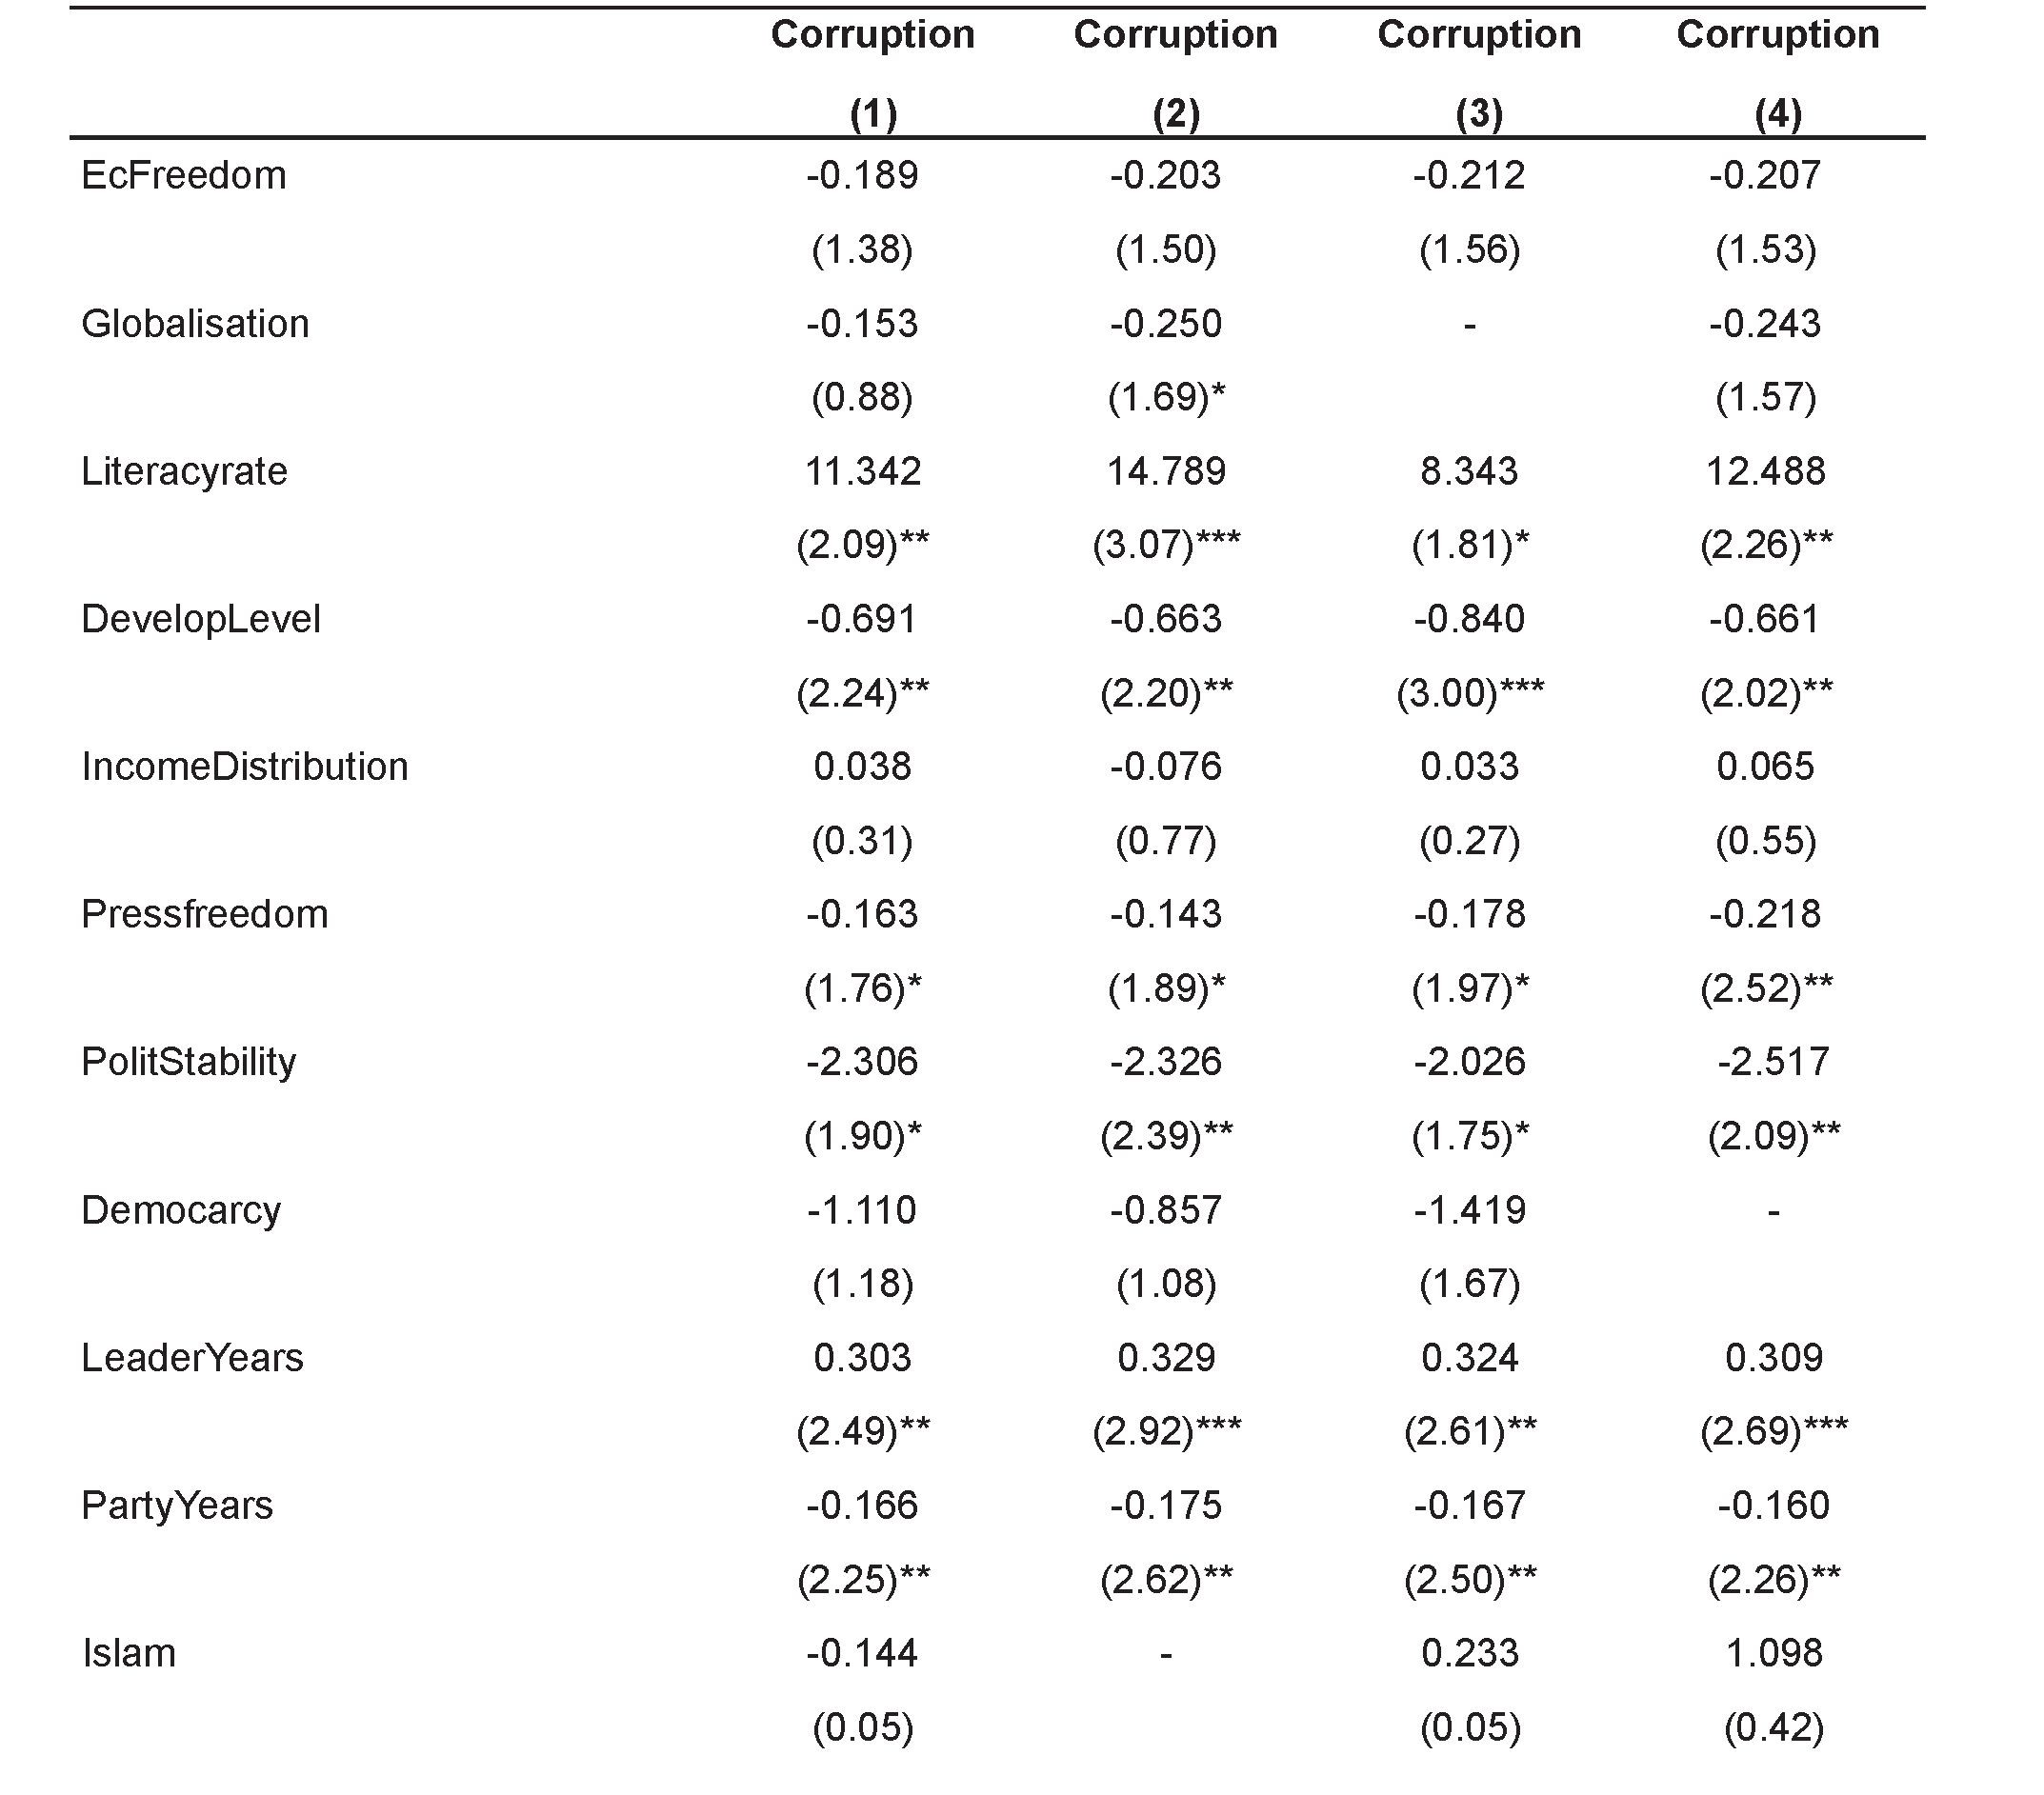
At last, I have put together the economic and political determinants of corruption in order to find out which of them has the significant roles in influencing the level of corruption. The results are presented below:
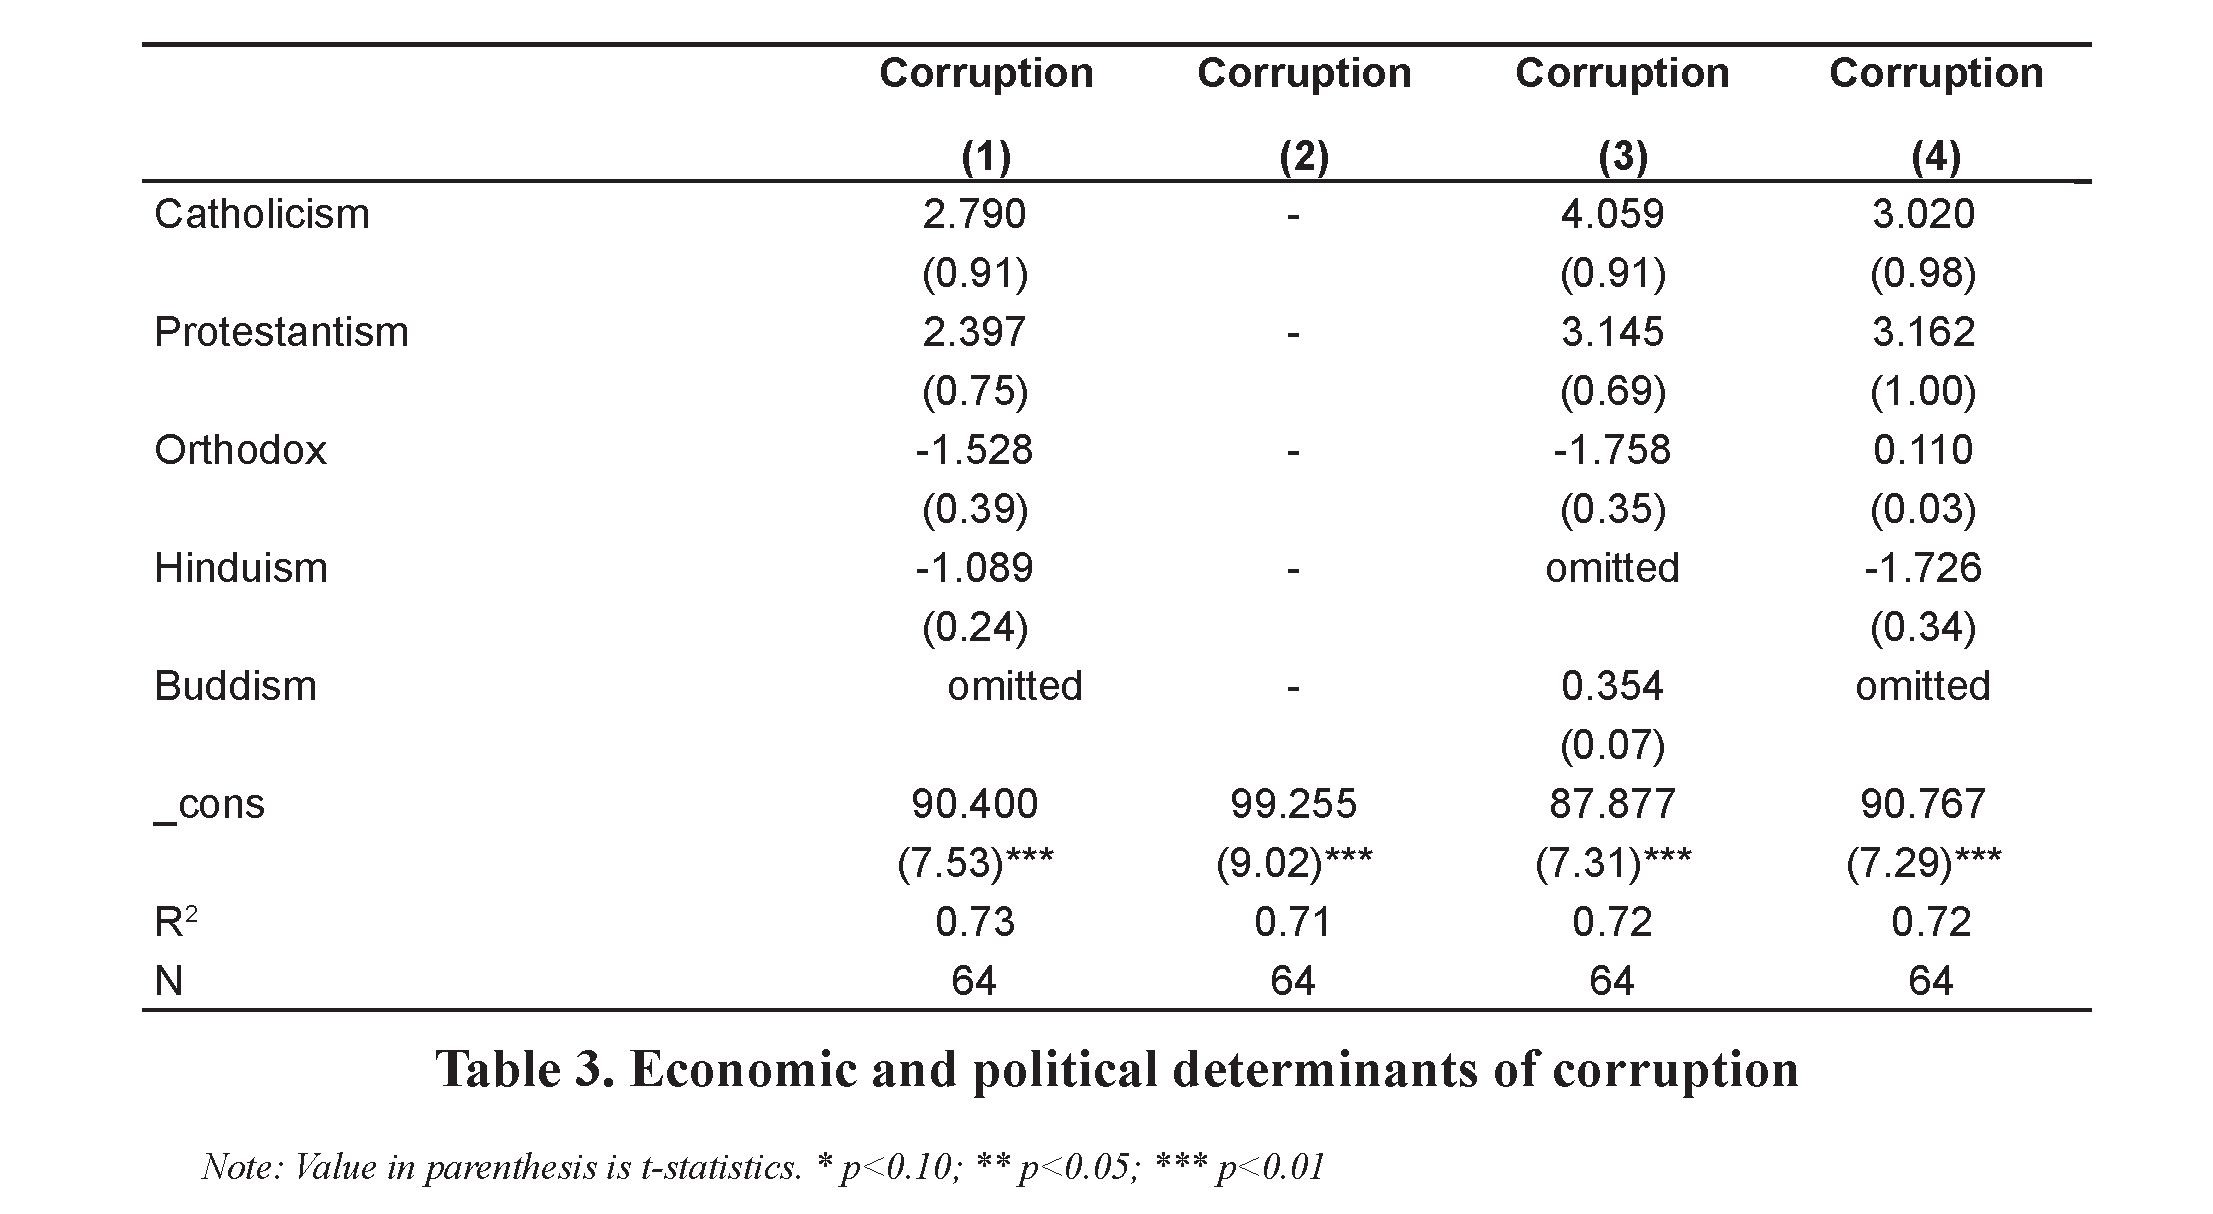 From the table above, it can be noticed that the political variables have the prevailing role in comparison with the economic variables in determining the level of corruption. Two economic variables are statistically significant across all the models as opposed to four statistically significant political variables. Literacy rate as in very first economic model remained powerful explanatory variable of the level of corruption. It has positive sign, meaning that higher level of literacy is expected to increase the level of corruption in the society. It is interesting to note how the variable level of development becomes significant in the combined model. It has the negative sign on coefficient, which means that the higher is the GDP per capita of particular country, the less corruption is expected to be in this country. In regards, to political determinants it is interesting to note how the variable freedom of press has become significant in the combined model. It has the negative sign on coefficient meaning that the higher is the level of freedom enjoyed by the press, the lower is the level of corruption in the country. This finding fits the general discourse about the importance of the free media resources in order to effectively addressing the corruption issues. The explanations for the other significant variables - political stability, years leader in power, years party dominates the seat in parliament have been provided in the previous model regarding the political determinants of corruption. It can be noticed that variables such as economic freedom, globalization, income distribution, democracy and dummies on religion have become insignificant in the combined model. Also, it should be indicated that R2 in combined model has increased to more than 70% in comparison with the only the economic or political models. The combined models explain more than 70% variation in the corruption level.
It is important to make sure that my independent variables are not correlated with each other. This is because the linear association between the independent variables lead to the multicollinearity problem. In order to check for multicollinearity I have applied the variance inflationary factor (VIF), the results are presented below:
In case the value of VIF exceeds the 10 there could be the problem of multicollinearity. However as it can be noticed from the table above the values of all the independent variables are below the 10. Consequently, it can be concluded that there is no linear association between my independent variables and the constructed model has the explanatory power in determining the level of corruption.
Conclusion
Taking everything into consideration, the findings from this paper imply that developing countries need to provide more freedom for the media resources and particularly journalists, maintain political stability and increase their GDP per capita in order to reduce the corruption level in their countries. Also, countries need to ensure the political pluralism and fair election processes in order to ensure regular political rotation, which consequently contributes to the lower corruption levels in the states.
RefeRences:
- Bhargova, Vinay 2005. “The Cancer of Corruption” World Bank Global Issues Seminar Series.
- OECD SIGMA 1998. Effects of European Union Accession, Part 1: Budgeting and Financial Control, Paper No. 19, March, Appendix 3: List of Useful Terms.
- United Nations 1997. United Nations Actions Against Corruption And Bribery.
- Shabbir Ghulam and Anwar Mumtaz 2008. “Determinants of corruption in developing countries”. The Pakistan Development Review. 46(4), pp. 751-764.