Abstract. Based on the monetary policy transmission channel within the financial crisis, this paper constructs a mixed cross-section global vector autoregressive model by using the quarterly data of thirteen countries which are members of the euro area in the period 2007 to 2017. It examines the regional asymmetric effects of the monetary policy implemented by the ECB for the economic recovery of member countries of the euro area. The results show that: (1) the response-trend characteristics of the macroeconomic indicators of the member countries in relation to monetary policy shocks are similar, but there is an obvious heterogeneity in the degree of impact and the response period; (2) from the perspective of cumulative response-stability value, financial countries with developed markets such as Germany and Finland have low stability values. They can digest the impact of monetary policy shocks. For relatively backward Greece, Ireland, etc., the result is the opposite; (3) the sensitivity of member countries to long-term interest rate shocks is greater than the impact on the impact of money supply; (4) under the influence of the European Stability Mechanism (ESM), the asymmetric effect of monetary policy regions has decreased. This study helps towards an understanding of the heterogeneity of ECB 's unconventional monetary policy transmission among member countries; and the positive role of fiscal unions in weakening the asymmetric effects of monetary policy.
In August 2007, the U.S. subprime mortgage crisis swept through the world's major financial markets. Credit contracted sharply in the euro area and the real economy declined substantially. Intending to contain the financial crisis and stimulate a wider economic recovery, the ECB took a wide range of measures, some of them innovative, especially the adoption of an expansionary monetary policy implemented mainly by lowering the interest rate of the dominant policy. When the interest rate fell nearly to zero, the financial market fell into a "liquidity trap".[14] Nevertheless, the European sovereign-debt crisis that erupted in 2009 paralyzed the continent, which had just had a chance to breathe. Accordingly, the ECB further strengthened the implementation of an unconventional monetary policy. The European Union Stability Mechanism (ESM),[15] which came into effect in October 2012, provides financial assistance and financial constraints to member countries facing severe debt crisis through joint funding from euro area countries, leading them out of the sovereign-debt crisis while enhancing the stability of the euro-area financial system. By the end of 2018, the ECB announced the end of its quantitative easing policy, but remained loose.
The implementation of an unconventional monetary policy as a reaction to the financial crisis has played a positive role in the economic recovery of the euro area and its member countries. However, in terms of degree and time, there is a strong heterogeneity in the transmission effect among member countries - that is, the regional asymmetric effect of monetary policy transmission. The asymmetry of transmission stems from the inherent contradiction between the unified monetary policy and the decentralized fiscal policy in the euro area. On January 1, 1999, some EU countries began to implement a single currency, the euro, and a unified monetary policy in the euro countries. The ECB has the characteristics of non-sovereignty and a single responsibility of stabilizing inflation targets in the euro area. Fiscal policies are implemented by the financial authorities of each member country in accordance with their own economic conditions and economic objectives. Because of the imbalance of economic development and the difference of fiscal policy implementation among the member countries, the impact of the unified monetary policy of the ECB has had an asymmetric effect on the economies of the member countries of euro area.
By reviewing the literature, this paper attempts to examine the asymmetric effect of monetary-policy shocks on the economies of member countries in the context of the financial crisis; and, moreover, whether this asymmetric effect has been improved under the launch of the ESM in 2012. The reasons for the regional effect will also be briefly analyzed. The approach taken in the paper is as follows: the first part reviews and summarizes the main literature on the regional effects of monetary policy at home and abroad, and gives the main research ideas on this basis; the second part briefly analyses the ECB 's unconventional monetary policy tools and corresponding interest rate transmission mechanism under the financial crisis, and selects the proxy variables under the unconventional monetary policy; the third part establishes the model and carries on the empirical research; the fourth part analyses the dynamic impact of monetary policy on the macroeconomic indicators of member countries; and the fifth part is the conclusion and the reasons for the regional differences of a single monetary policy in the euro area.
Literature Review
Regional Asymmetric Effects of Monetary Policy, or spatial inconsistency, means that the formulation and implementation of unified monetary policy by monetary authorities have different impacts and effects on regions with different economic characteristics and operating cycles. Its research history can be roughly divided into three stages: The first stage (1950-1980) is an early study. Scott 's “Regional Impact of Monetary Policy” (1955) analyzed the lagging effect of open-market operations from central New York to other regions. The second stage (1990-2000) is related to the birth of European Monetary Union and the euro area. Mundell ‘s (1961) Optimal Currency Areas (OCA) argued that the unified currency (Euro) deprives member countries of exchange rate fluctuation mechanism, which had caused asymmetric shocks to member countries. The monetary union needs appropriate fiscal policy tools to adjust the asymmetric shocks among member countries. The third stage (after 2000) is the empirical research stage. Scholars began to try different measurement methods and continue to improve them. Britton & Whitley (1997) used the Mundell-Flemming model to study the output effect of the economy on interest rates. Under the impact of interest rates, the output effect of Germany is stronger than that of Britain. A large number of scholars also draw lessons from Carlino & DeFina (1998) to establish independent Regional Vector Autoregression (VAR) Model. For example, Peersman & Smets (2001) constructed VAR model on the premise of long-term constraints. Research shows that for Germany with strong economic strength, the output effect of monetary policy is higher than that of Italy and France, but the trend of difference is declining; Toolsema et al. (2002) empirical study of six euro area member countries found that there were significant differences in initial and long-term responses to monetary policy shocks among countries, and the differences were longterm persistence; Rafiq & Mallick (2008) applied a new VAR identification procedure to study the impact of monetary policy shocks on the output of the three major euro area economies (Germany, France and Italy), and found that monetary policy transmission in Germany is the most effective. Chinese scholars Anping Chen (2007),Tongjuan Cai (2012) and Jialin Hunag(2017) also used VAR model to verify the regional asymmetric effect of China's monetary policy.
However, with the deepening of research, the defects of the VAR model are highlighted. For the study of more regions, if we construct independent VAR models, the number of endogenous variables in the model will increase and the estimated results will deviate from reality. Hong Zhang and Yang Li (2013) used the global vector autoregressive model (GVAR), which has just emerged in recent years, to investigate the differential impact of monetary policy shocks on real estate in thirty provinces and cities. In addition, how to integrate monetary policy into a unified framework is also a major issue. It is unreasonable for some scholars to embed the generalized money supply as an endogenous variable in the unit VAR model. The formulation of monetary policy is based on the overall economic situation. If it is regarded as an endogenous variable in a certain region alone, it is easy to ignore the asymmetry of monetary policy in the transmission process. In this regard, Georgios & Georgiadis (2015) studied the transmission of single monetary policy shocks between different economies in the euro area. By constructing a global VAR model, all euro area economies were included, and the single monetary policy was simulated as a function of total output growth in the euro area. On the one hand, considering the fact that the ECB's monetary policy adjustment is aimed at the overall economic situation, on the other hand, the analytical framework can conduct relatively independent reviews of various regions (member countries).
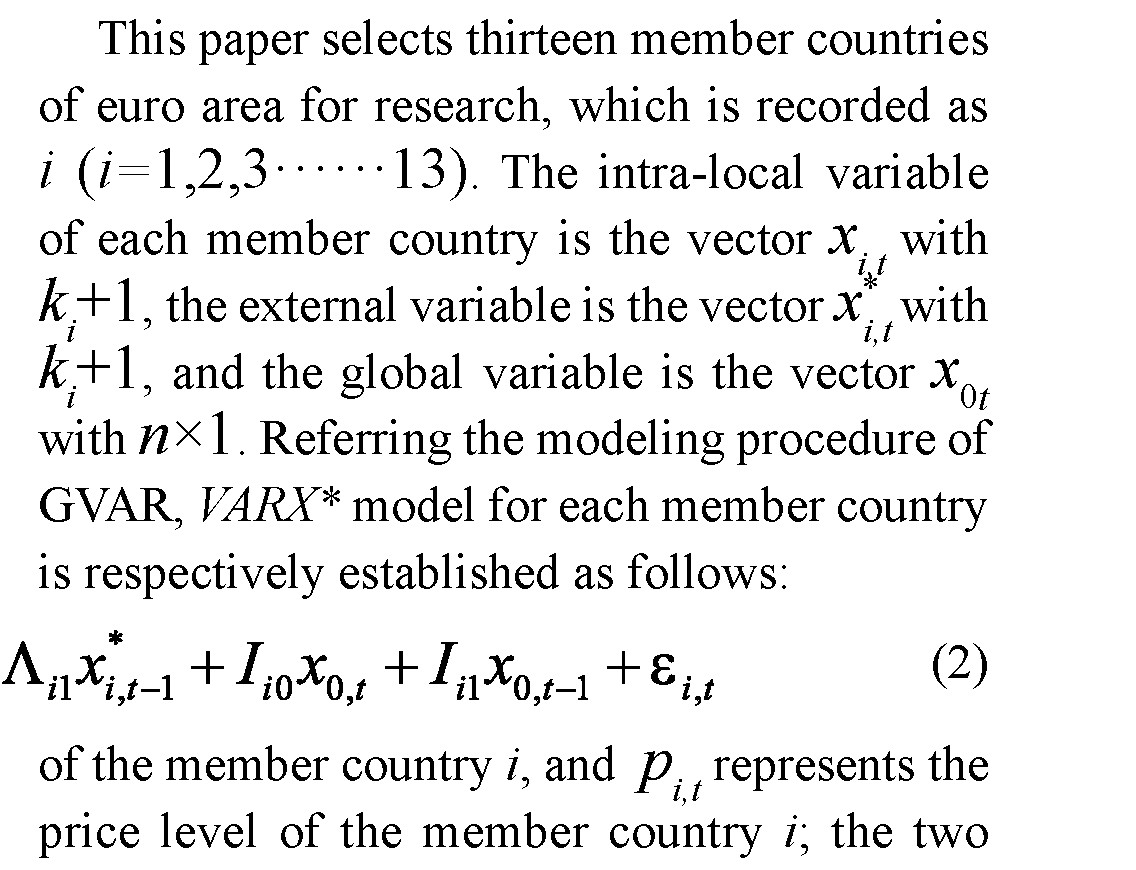
The Vector Autoregression (VAR) model thus ignores the excessive endogenous variables in the model, the spillover effect among regions, and the failure to incorporate monetary policy into the unified analysis framework. The GVAR model takes into account the intrinsic relationship between regions, and can analyze effectively the response of endogenous variables to monetary policy shocks and spillover effects among economies through the "connection matrix". However, the deficiency of the GVAR model is that monetary policy is added to the regional VAR model, and the fact that the ECB 's monetary policy formulation is aimed at the overall economic situation has not yet been taken into account. For this reason, we use the research ideas of Georgios & Georgiadis (2015) for reference, and add the ECB as a unit parallel to other economies into the GVAR model to construct a Mixed Cross-Section GVAR (MCSGVAR) model.
ECB's Monetary Policy Response and Transmission Channel after the Financial Crisis
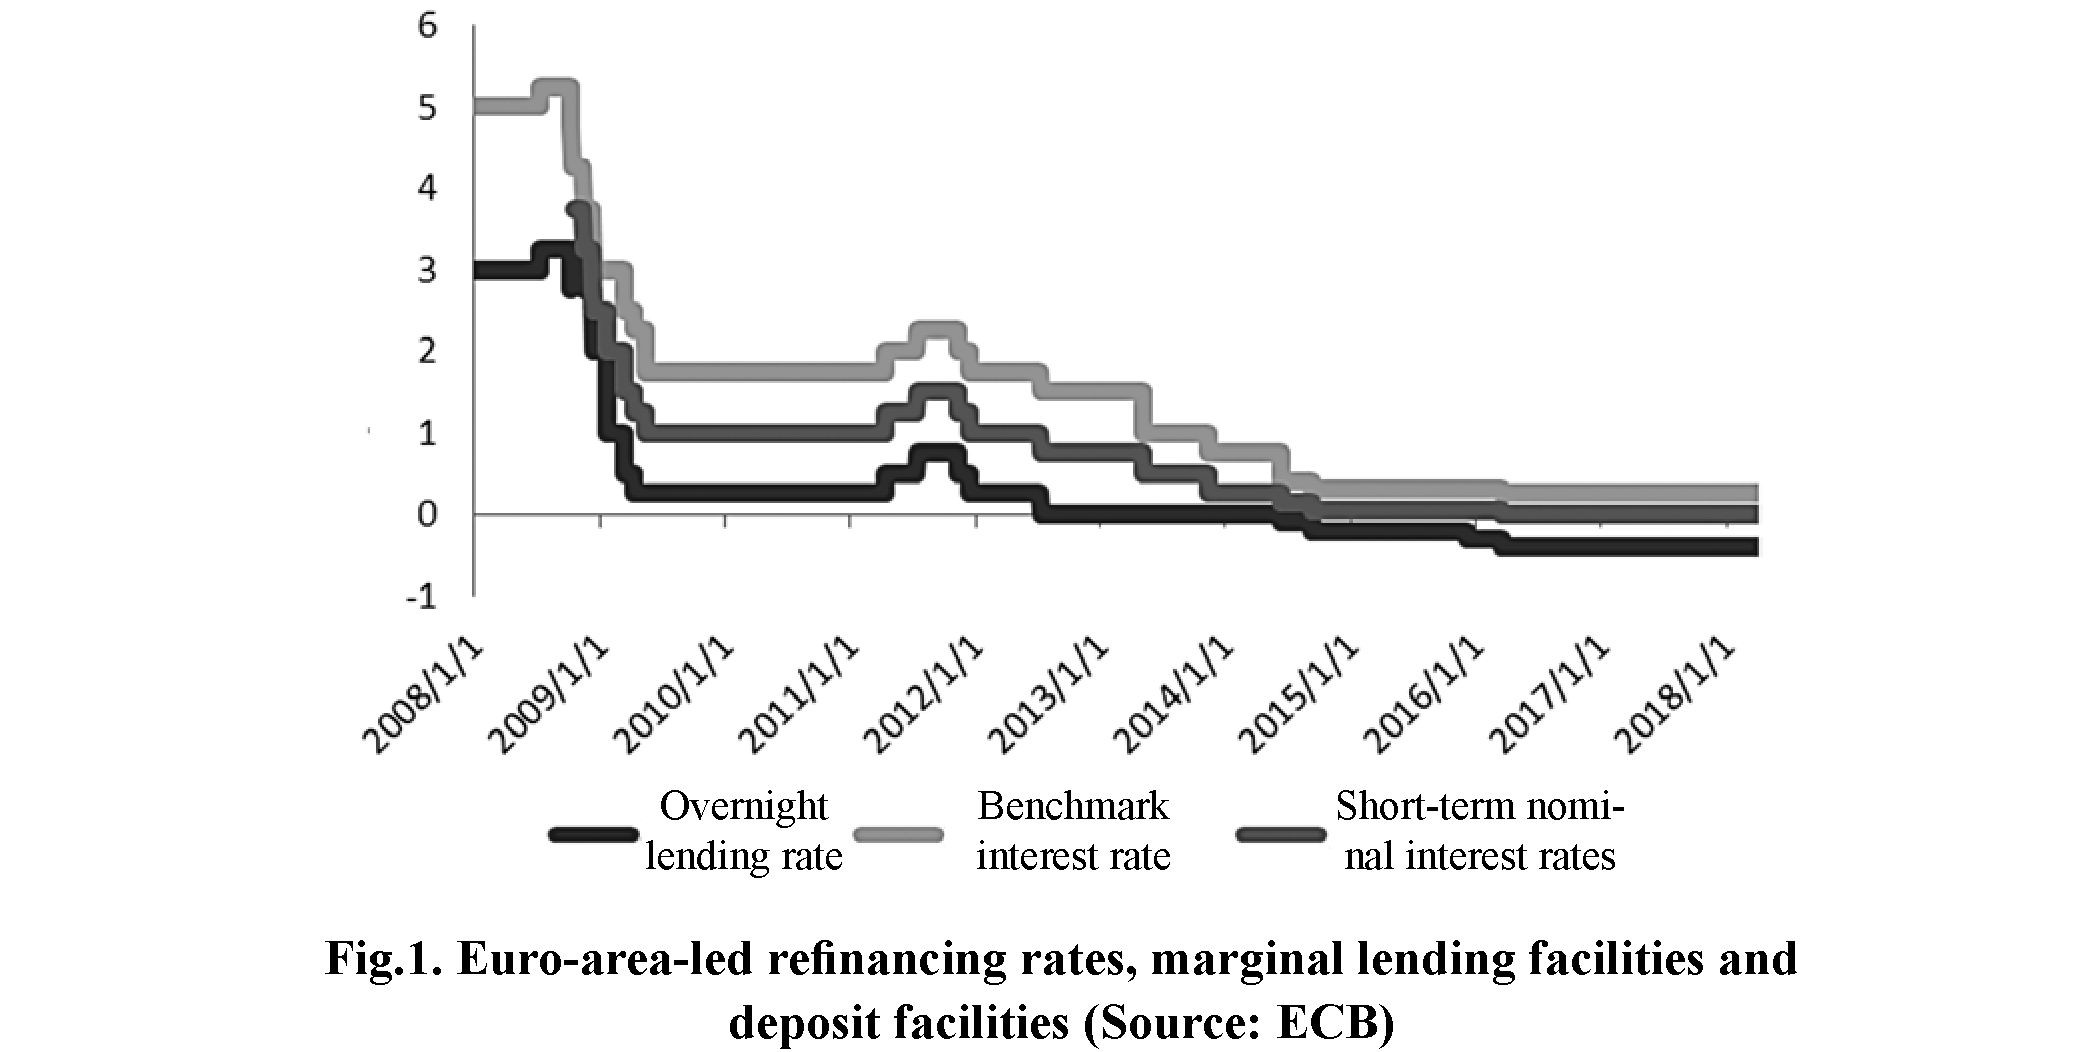
Euro-area monetary policy is regulated by the ECB. Under normal economic conditions, the ECB regulates interest rates and total monetary supply through conventional monetary policy to achieve the set policy objectives. Specifically, the ECB mainly regulates the leading refinancing rate as a signal of monetary policy implementation. After the international financial crisis, the ECB has repeatedly lowered its benchmark interest rate (see figure 1). In May 2009, the ECB lowered its benchmark interest rate to 1%, in June 2014, to 0.15. At the same time, the overnight lending rate was lowered to 0.4%, and the deposit rate was lowered to -0.1%. So far, short-term nominal interest rates in the euro area have fallen to freezing point, and the central bank has been unable to cope with the worsening European debt crisis by adjusting the conventional monetary policy of the benchmark interest rate. Until the end of 2017, short-term nominal interest rates remained near zero.
The short-term benchmark interest rate directly controlled by the central bank through traditional monetary policy instruments is usually not the basis for the decision-making of economic entities. The real impact on investment and consumption is the long-term interest rate or other asset prices in the financial market. At the early stage of the financial crisis, the ECB reduced the leading refinancing interest rate and prolonged a refinancing operation to avert the
2010, the ECB announced the implementation of the Securities Markets Programme12 that subsequently was replaced by the OMT13 in June 2012. Although there are different implementations of unconventional monetary policy, they can be summarized as three types: ultra-long-term low interest rate forward-looking guidance, adjusting the balance sheet size and structure of the central bank and inflation expectations.14 The unconventional monetary policy changes the market's preference for asset investment through the above three ways, and then affects the yield of long-term bonds and repairs the damaged interest rate transmission channel.
So how does unconventional monetary policy affect long-term bond yields? Arvind & Annette’s crisis. When the nominal interest rate adjustment approached the zero lower limits, the market fell into a "liquidity trap". The adjustment of shortterm policy-directed interest rate could not be transmitted to the yield of medium and long-term bonds. The central bank could not stimulate the economy and restrain the deflation by relying solely on conventional monetary policies such as ultra-low interest rate. At this time, unconventional monetary policy played an important role in overcoming the economic crisis and achieving economic recovery. The ECB adopted a series of "quantitative"9 unconventional monetary policies called Enhanced Credit Support Policy, the Securities Markets Programme and Outright Monetary Transactions (OMT)10 The Enhanced Credit Support Policy11 was implemented after the bankruptcy of Lehman Brothers in September 2008. With Greece's sovereign debt crisis evolving into European sovereign debt crisis in (2011) research shows that any long-term return can be decomposed into an expected component and a risk premium component, and the central bank can aim to reduce either or both to achieve its objectives.
The ECB 's "forward-looking guidance" on ultra-long-term low interest rates can achieve the effect of continuously reducing the market forward short-term interest rate and the expected component of long-term interest rate. Some scholars have proved that through the conditional low-interest-rate forward-looking guidance, the central bank guides the public's expectations of future interest-rate policy and interest-rate trend, which helps to stabilize the short-term and longterm interest rate expectations of the market, thus affecting asset prices and real economic activities (Ueda. 2012; Bernanke & Reinhart, 2004; Woodford, 2012).
Effect of Fed funds futures changes on predicted future realized Fed fund rates is a bit less than 1-for-1 because Fed funds futures rates
- Relative to the “price-based” monetary policy control measures, during the financial crisis, the size of the central bank’s balance sheet was adjusted to adjust asset prices, medium- and long-term yields, and money supply.
- The implementation of OMT coincides with the formal launch of the ESM, if recipient countries fail to meet their promised fiscal tightening and structural reform measures, the ECB will suspend the purchase of bonds.
- The Enhanced Credit Support is a combination of policy measures, including Super L-TRO , Fixed Rate Full Allotment, increased central bank asset purchases, currency swaps, the Collateralized Bond Purchase Plan (CBPP).
- Securities Markets Programme aims at purchasing government bonds from the secondary market, helping the euro area government bond market to restore its financing function, so as to ensure the smooth operation of monetary policy transmission channels.
- OMT refer to the ECB 's commitment to buy government bonds in a fully satisfied manner for eligible euro area countries until policy objectives are achieved.
- After the financial crisis, the ECB maintained its low interest rate at 2% of its inflation expectation target.
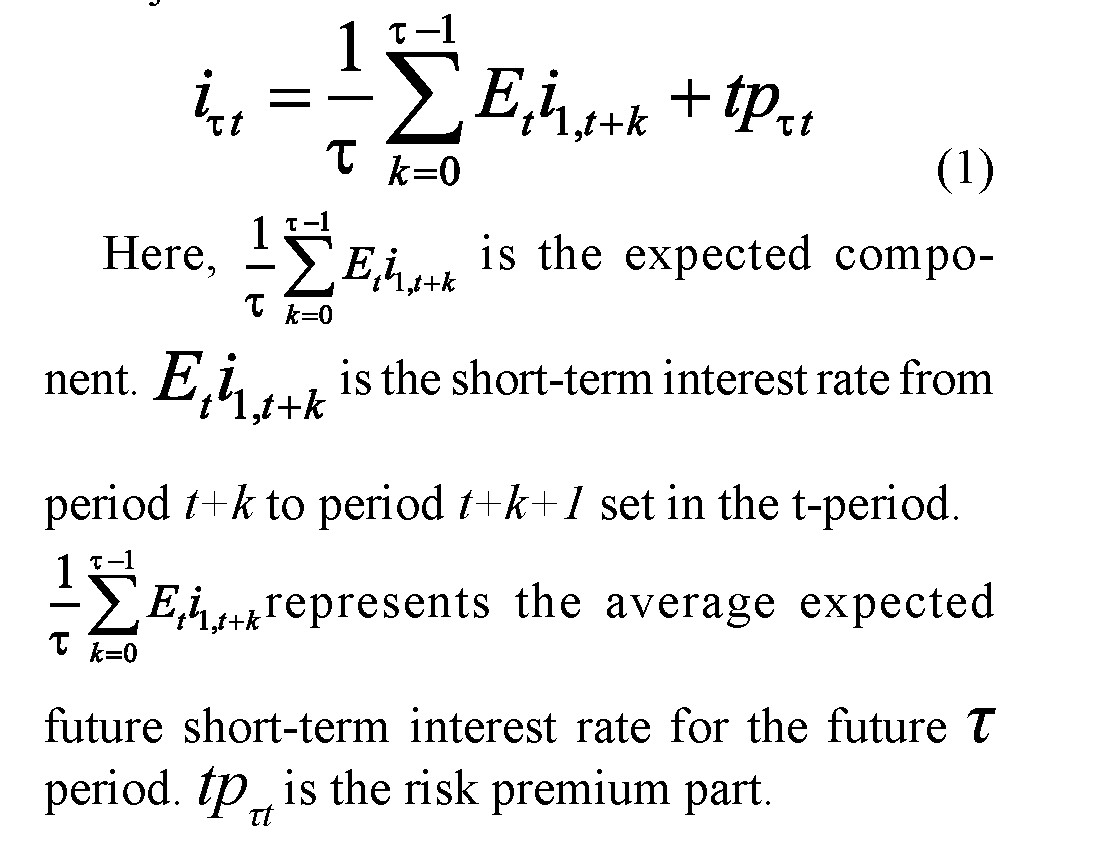
contain a risk premium (Piazzesi and Swanson, 2008) which varies with the level of short rates and the business cycle. The risk premium is tpτt of the above formula. Referring to the research results of Arvind & Annette (2011), risk premium includes six types: (1) Duration risk premium. In QE, when ECB purchased long-duration assets from the private sector, the market price of the duration risk decreases. (2) Pre-payment risk premium. In the MBS market, because of the expectations for a long-term stable low interest rate, the private sector tends to advance repayment of relatively high-interest rate mortgages, which carries a positive risk premium. (3) Default risk. If QE succeeds in stimulating the economy, we can expect that the default risk of corporations will fall. Also, investor risk-aversion may fall as the economy recovers, implying a lower default risk premium. Increasing health/capital in the intermediary sector can further lower risk premium on default risk. (4) Safety premium. That is the security premium of zero default risk bonds. By purchasing the sovereign bonds of member countries, the ECB can raise their prices and reduce the security premium as well. (5) Liquidity premium. QE involves purchasing long-term securities and paying by increasing reserve balances which are likely more liquid; and which will cause a reduction in the price premium of liquid assets (yield increase). (6) Inflation Risk Premium. The ECB signaled that it would maintain its asset purchase plan until inflation reached its target of 2%. This can be expected to have a positive effect on nominal interest rates. To sum up, the ECB asset purchase plan and inflation-expectation target can affect the balance of supply and demand in the bond market to reduce the risk premium in long-term interest rates.
In the course of the ECB using expansionary unconventional monetary policy to deal with the financial crisis, a “forward-looking guidance” type of unconventional monetary policy can reduce the expected component of the market for forward interest rates. The "asset-purchase plan" and "inflation target" types of unconventional monetary policies can reduce the expected component of the forward interest rate. Ultimately, the long-term bond yield will be reduced, and the blocked interest-rate transmission mechanism will be restored to promote economic recovery. Therefore, after the financial crisis, on the basis of the short-term interest rate bound by the zero- lower bound (ZLB), the use of long-term interest rates to represent the monetary policy under the financial crisis is more relevant.
Empirical Analysis of Regional Asymmetric Effect
Global VAR model (GVAR) was first introduced by Pesaran (2004). The GVAR model is an extension of the VAR model. It is a global model composed of many economies and mainly used to analyze the economic impact relationship between different regions. However, considering that the ECB's monetary policy is aimed at improving the overall economy of euro area, this paper refers to the practice of Georgios & Georgiadis (2015), and adds the ECB as an independent cross-sectional unit to the GVAR model in parallel with the economies of euro area, constructing the MCSGVAR model.
1.1. The Setting of MCSGVAR Model
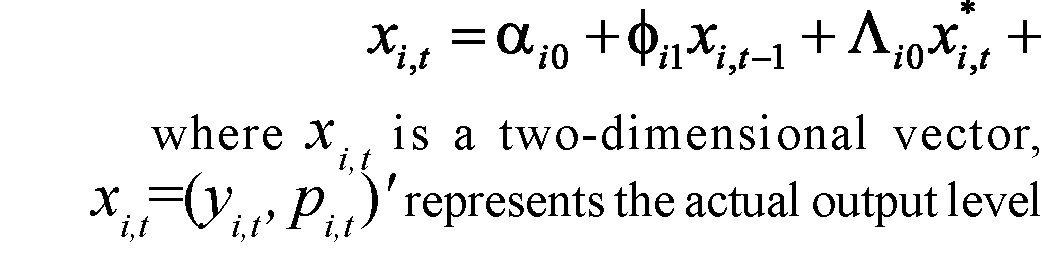
1.1.1. Constructing VAR models of member countries
The above data mainly comes from Eurostat, ECB, World Bank WDI database and OECD Statistics.
For the preliminary processing of data, we first consider the seasonal factors and adopt Gensus X12 method to seasonally adjust the sequence of related variables.[16] Secondly, in view of the possible heteroscedasticity of the sequence, we take logarithmic processing of the variables after seasonal adjustments to eliminate the influence of heteroscedasticity.
1.3. Establishment of weights among member countries
In the process of constructing external variables, x*it needs a connection matrix to effectively combine the VARX* models of member countries to reflect the degree of economic interaction among member countries. By combing the relevant literature, it is found that some scholars choose the distance between two regions to represent the connection (weight) matrix, and some scholars choose the trade flow between the two regions. Based on the research methods of Zhang Hong and Li Yang (2014), in order to more intuitively reflect the economic relevance among member countries, this paper chooses the average value of trade flows among member countries from 2007 to 2017 and weights them,[17] that is, wii (Trade flows from member country j to member country i / trade flows from member country i to all countries). The trade weight matrix of 13 countries in euro area, as shown in Table 1:
Table 1. Trade weight matrix among member countries
|
Cou |
bel |
germ |
ire |
gre |
spain |
fra |
italy |
lux |
neth |
aus |
por |
slo |
fin |
|
bel |
— |
0.11 |
0.26 |
0.07 |
0.06 |
0.16 |
0.08 |
0.28 |
0.22 |
0.03 |
0.04 |
0.03 |
0.08 |
|
germ |
0.28 |
— |
0.22 |
0.27 |
0.25 |
0.35 |
0.33 |
0.36 |
0.43 |
0.65 |
0.19 |
0.35 |
0.41 |
|
ire |
0.04 |
0.02 |
— |
0.02 |
0.02 |
0.02 |
0.01 |
0.01 |
0.02 |
0.01 |
0.01 |
0.00 |
0.02 |
|
gre |
0.01 |
0.01 |
0.01 |
— |
0.01 |
0.01 |
0.02 |
0.00 |
0.01 |
0.01 |
0.00 |
0.01 |
0.01 |
|
spain |
0.04 |
0.08 |
0.08 |
0.08 |
— |
0.15 |
0.12 |
0.02 |
0.05 |
0.03 |
0.44 |
0.04 |
0.06 |
|
fra |
0.22 |
0.22 |
0.20 |
0.11 |
0.28 |
— |
0.23 |
0.19 |
0.14 |
0.07 |
0.14 |
0.10 |
0.11 |
|
italy |
0.07 |
0.15 |
0.07 |
0.26 |
0.15 |
0.16 |
— |
0.04 |
0.07 |
0.13 |
0.07 |
0.26 |
0.09 |
|
lux |
0.02 |
0.01 |
0.01 |
0.01 |
0.01 |
0.01 |
0.00 |
— |
0.01 |
0.00 |
0.01 |
0.00 |
0.01 |
|
neth |
0.27 |
0.20 |
0.12 |
0.11 |
0.08 |
0.09 |
0.00 |
0.06 |
— |
0.04 |
0.07 |
0.04 |
0.17 |
|
aus |
0.01 |
0.13 |
0.01 |
0.03 |
0.02 |
0.02 |
0.09 |
0.01 |
0.02 |
— |
0.01 |
0.15 |
0.03 |
|
por |
0.01 |
0.02 |
0.01 |
0.01 |
0.12 |
0.02 |
0.05 |
0.01 |
0.01 |
0.01 |
— |
0.01 |
0.01 |
|
slo |
0.01 |
0.01 |
0.00 |
0.01 |
0.00 |
0.01 |
0.02 |
0.00 |
0.00 |
0.03 |
0.00 |
— |
0.00 |
|
fin |
0.01 |
0.02 |
0.01 |
0.01 |
0.01 |
0.01 |
0.01 |
0.00 |
0.02 |
0.01 |
0.01 |
0.01 |
— |
1.4. Estimation results of the model
Before estimating the MCSGVAR model, in order to determine the form of relevant variables, some necessary tests are needed. First, we test the unit root of the variables involved in the VARX* model of each member country. The results show that the real GDP, HICP and monetary policy proxy variables are stationary after the first-order difference, i.e., all variables are I (1) series.[18] Second, the Johansen cointegration test is applied to the relevant variables, trace and maximum eigenvalue tests are used to determine the rank of cointegration. The trace test[19] is used in this paper. The results show that the rank of eight member countries is 2, and the other three to four cointegration relations. Therefore, according to the GVAR model, weak exogenous tests are needed for the external and global variables in the co-integration relationship (see Table 2). The results show that the confidence level of 5% is not significant, that is, the original hypothesis can hardly be rejected by the external variables and the global variables in the co-integration model.
They meet the weak exogenous condition, which indicates that these variables have a long-term effect on some variables in the model.
Table 2. Weak exogenous test of external and global variables in cointegration model
|
Cou |
F test |
Crit_5% |
y* |
u* |
d* |
p* |
m |
lr |
|
bel |
F(2,28) |
3.34 |
3.06 |
2.40 |
2.13 |
6.04** |
0.48 |
1.05 |
|
germ |
F(4,19) |
2.90 |
2.06 |
1.18 |
1.78 |
1.17 |
0.70 |
0.30 |
|
ire |
F(2,22) |
3.44 |
0.21 |
0.65 |
1.03 |
3.04 |
0.85 |
0.81 |
|
gre |
F(3,27) |
2.96 |
2.80 |
4.07** |
1.06 |
1.78 |
1.68 |
0.65 |
|
spain |
F(2,19) |
3.52 |
0.80 |
0.61 |
0.78 |
1.50 |
0.63 |
0.14 |
|
fra |
F(2,28) |
3.34 |
1.86 |
7.82** |
0.56 |
0.05 |
1.12 |
0.07 |
|
italy |
F(2,17) |
3.59 |
2.90 |
0.15 |
0.62 |
2.18 |
0.78 |
0.39 |
|
lux |
F(2,23) |
3.42 |
7.51** |
3.39 |
2.96 |
3.23 |
0.24 |
0.20 |
|
neth |
F(3,24) |
3.01 |
2.98 |
2.59 |
2.88 |
0.18 |
0.62 |
0.10 |
|
aus |
F(2,28) |
3.34 |
0.43 |
1.84 |
0.35 |
1.17 |
0.98 |
0.21 |
|
por |
F(4,26) |
2.74 |
0.54 |
2.16 |
1.17 |
0.90 |
2.33 |
0.70 |
|
slo |
F(2,28) |
3.34 |
2.47 |
0.49 |
0.46 |
0.56 |
0.44 |
0.23 |
|
fin |
F(3,18) |
3.15 |
2.40 |
0.65 |
1.28 |
2.13 |
1.80 |
0.33 |
Note: ** represents a significant level confidence of 5%variables do not satisfy weak exogenous condition.
Based on the completion of the model estimation and correlation test, the eigenvalues of the intra-local variables all fall in the unit circle, which shows that the MCSGVAR model is stable. The following is a dynamic analysis of the model, which is divided into two steps: (1)Investigate the impact of monetary policy shock on the economic activities of member countries, mainly including the differences between real GDP and HICP's response to monetary policy shock among member countries; (2)The European Stability Mechanism (ESM) came into effect in October 2012 and so we divided the timeline into two stages: 2007 Q1-2012 Q4, 2012 Q4-2017 Q4, and observed whether the fiscal constraints of the EU have weakened the regional heterogeneity of the single monetary policy.
In this paper, the generalized impulse response function (GIRF) is used to further analyze the dynamic relationship among the unit-model variables of each member country. GIRF mainly reflects the dynamic impact of a single standard deviation variable on other variables. Because there are many variables in the MCSGVAR system, it is difficult to determine the order and constraints of these variables, while GIRF is not affected by the number and ranking of variables in the system model. Next, we use GIRF to analyze in detail the asymmetric effects of monetary policy on Euro area economies in the context of the financial crisis.
4.1. The impact of long-term interest-rate shock on the economic activities of member countries
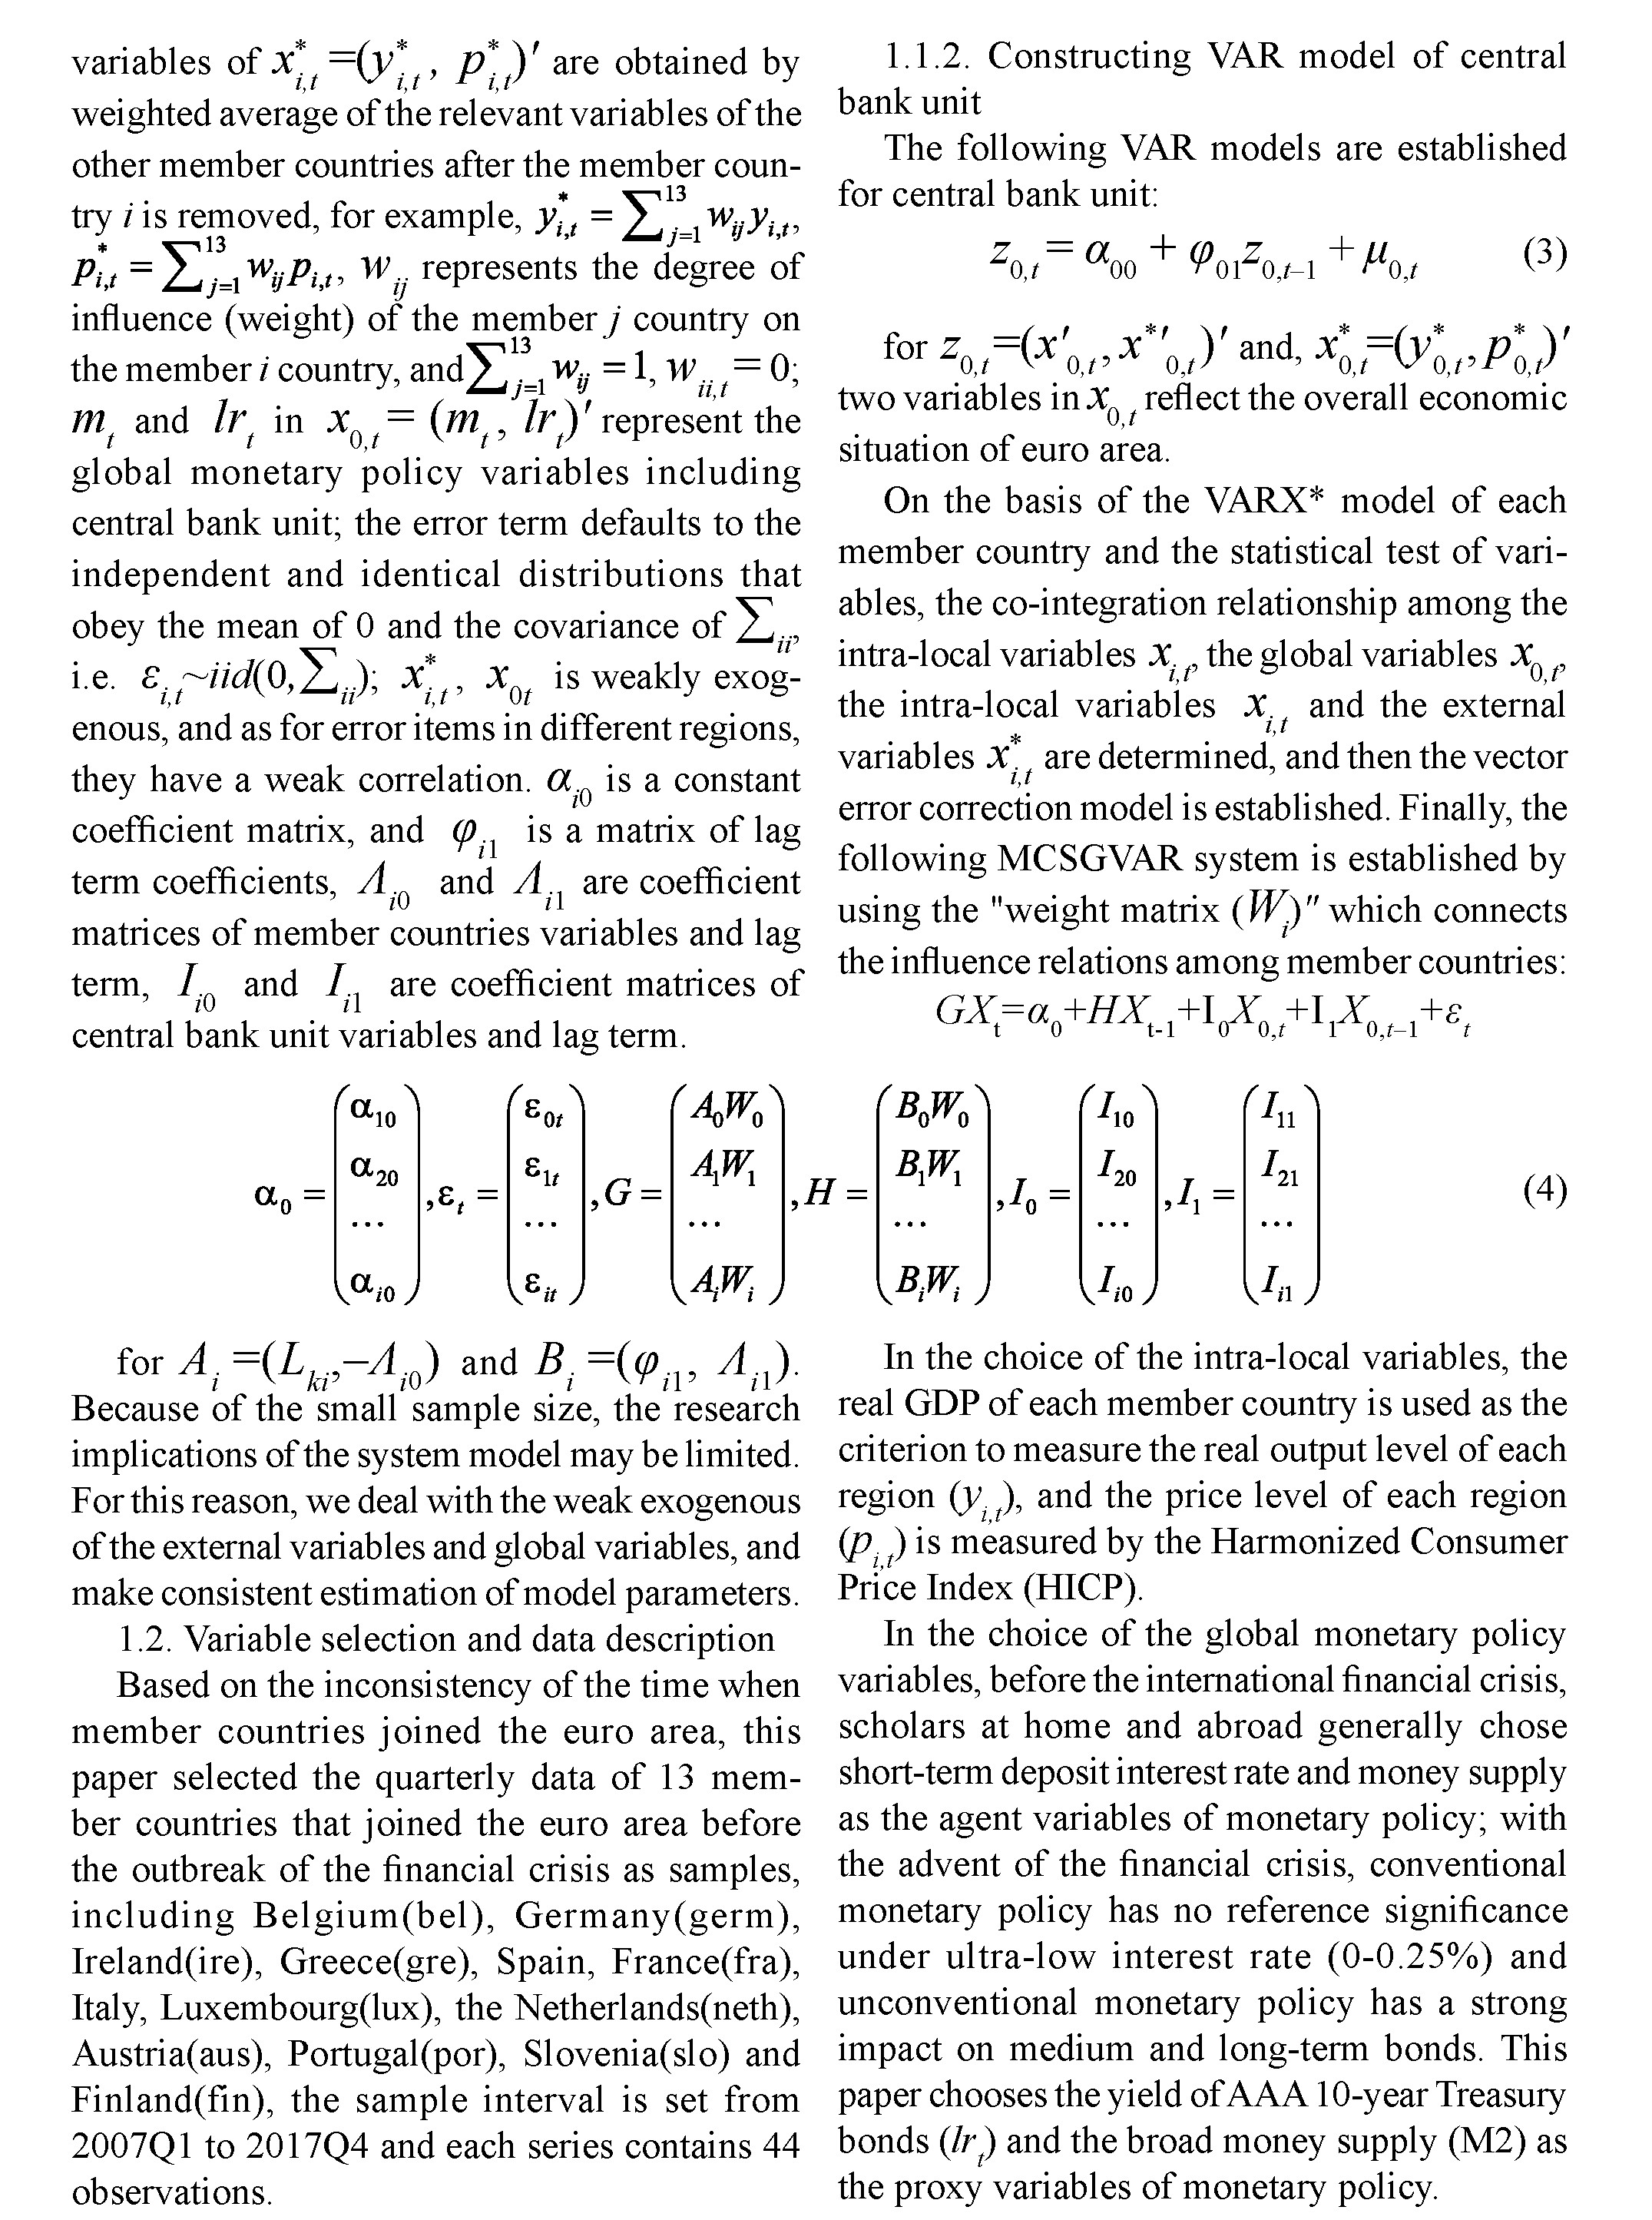
4.1.1. The impulse response of real GDP growth rate to long-term interest-rate shock
The impulse-response results are shown in Figure 2 (a) to illustrate the impulse response of real GDP growth rates to long-term interest rates in the five member countries of the euro area. Horizontally, under the impact of the longterm interest- rate unit-structure information, the GDP growth rate of each member country is similar in the reaction trend. From the third period, the reaction trend is generally shown as: “rising first, then declining, and then tending to zero”. However, the long-term interest-rate shock has a certain time lag on the economic growth of countries. There are differences in the maximum response periods of 13 countries in the euro areas: Belgium, Spain and Portugal in the first period; Germany and France in the second period; and other countries in the 1-5 periods. Longitudinally, there are also obvious differences in responsiveness: France receives less shock and does not respond strongly, giving positive response in the first two periods and turning negative response in the third period; Germany, Austria and Finland respond more strongly to the long-term interest rate shock; Germany responds positively after giving negative response in the first period, and has an oscillation from the ninth period to the negative response, and finally tends to be stable.
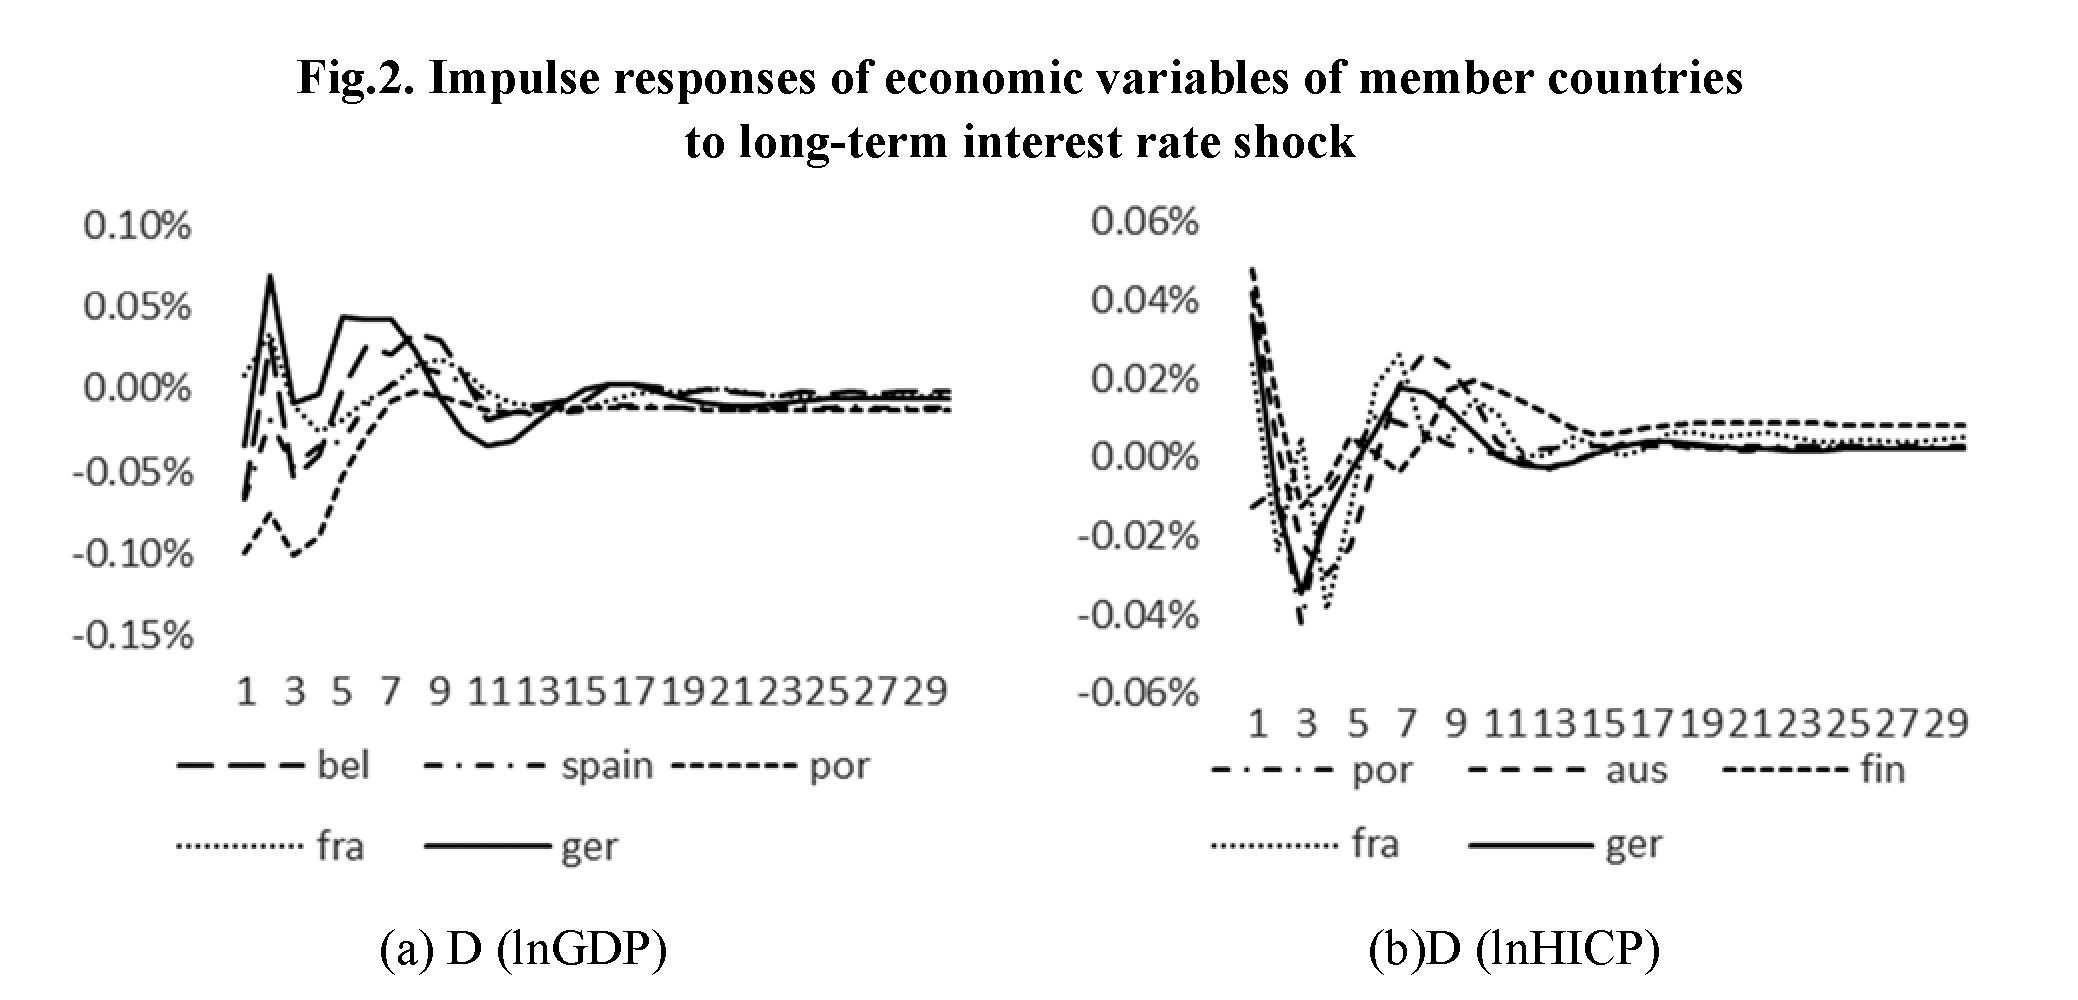
The cumulative impulse response coefficients of each member country are in the confidence interval,[20] which means that the estimation of cumulative impulse response coefficients is effective. Table 3 describes the cumulative response of economic variables of 13 euro area countries to unconventional monetary policy shock. It can be seen that the maximum cumulative response periods among member countries are inconsistent. For example, Belgium, Ireland and France are in the second period, and that of Italy is in the eighth period, which is much later than that of other countries. In addition, the maximum cumulative response values of different countries are also different, with relatively high Ireland (-10.6), Portugal (-6.0), Slovenia (-8.0) and lower Belgium (0.7), France (0.7), Germany (1.7), the corresponding stability values of countries with maximum cumulative response value are also higher. It indirectly reflects the strong economic strength of core countries such as Germany, France and Belgium. In the long run, these countries can better digest the impact of interest rate shock, while in the weaker economies of the euro area, the change of GDP is more sensitive to interest rate shock, and the cumulative impulse restores stability for a long time.
4.1.2 Impulse response of changes in price level to long-term interest-rate shock
The long-term interest-rate shock has also produced a certain degree of asymmetry in the price level of member countries. As can be seen from Figure 2(b), the maximum shock response to the French price level was in the fourth period, Austria, Portugal, Finland and Germany reached the maximum response in the first period, and the overall trend generally showed “first decline and then rise, then tend to 0". In terms of the degree of response, for a positive change in long-term interest rates, the maximum response to price changes in Finland, Austria and Germany is positive and all above 0.03 percentage points; while the maximum response to price changes in Portugal and France is negative and about -0.04 percentage points or so. In the sixth period member countries began to experience small fluctuations and in the 11th period they tended to stabilize.
In terms of cumulative response (see Table 3), the periods of maximum cumulative response of member countries are not consistent and basically concentrated in the first five periods. Ireland's cumulative maximum response is in the eighth period. The degree of response of price changes to interest-rate shock is inconsistent. Belgium, Ireland, Luxembourg, the Netherlands and Finland's cumulative peak responds positively; while Spain, Greece, Italy and Portugal's peak responds negatively. In terms of cumulative-response stability value, Spain and Greece have negative stability value. In particular, Greece has been hit hard by the European debt crisis; the domestic economy has obviously declined, resulting in deviations in the transmission effect of long-term interest rates, and they have been eliminating the impact for a long time; while most member countries have turned to positive response in the period of cumulative stability, indicating that unconventional monetary policy has a positive effect on the price level in the long run.
The monetary policy transmission channel in the context of the financial crisis is mainly reflected in the impact of unconventional monetary policy represented by long-term interest rates. For the impact of the adjustment of the ECB's money supply on the economic activities of member countries, we will make a brief analysis below.
4.2. The impact of money-supply shock on the economic activities of member countries
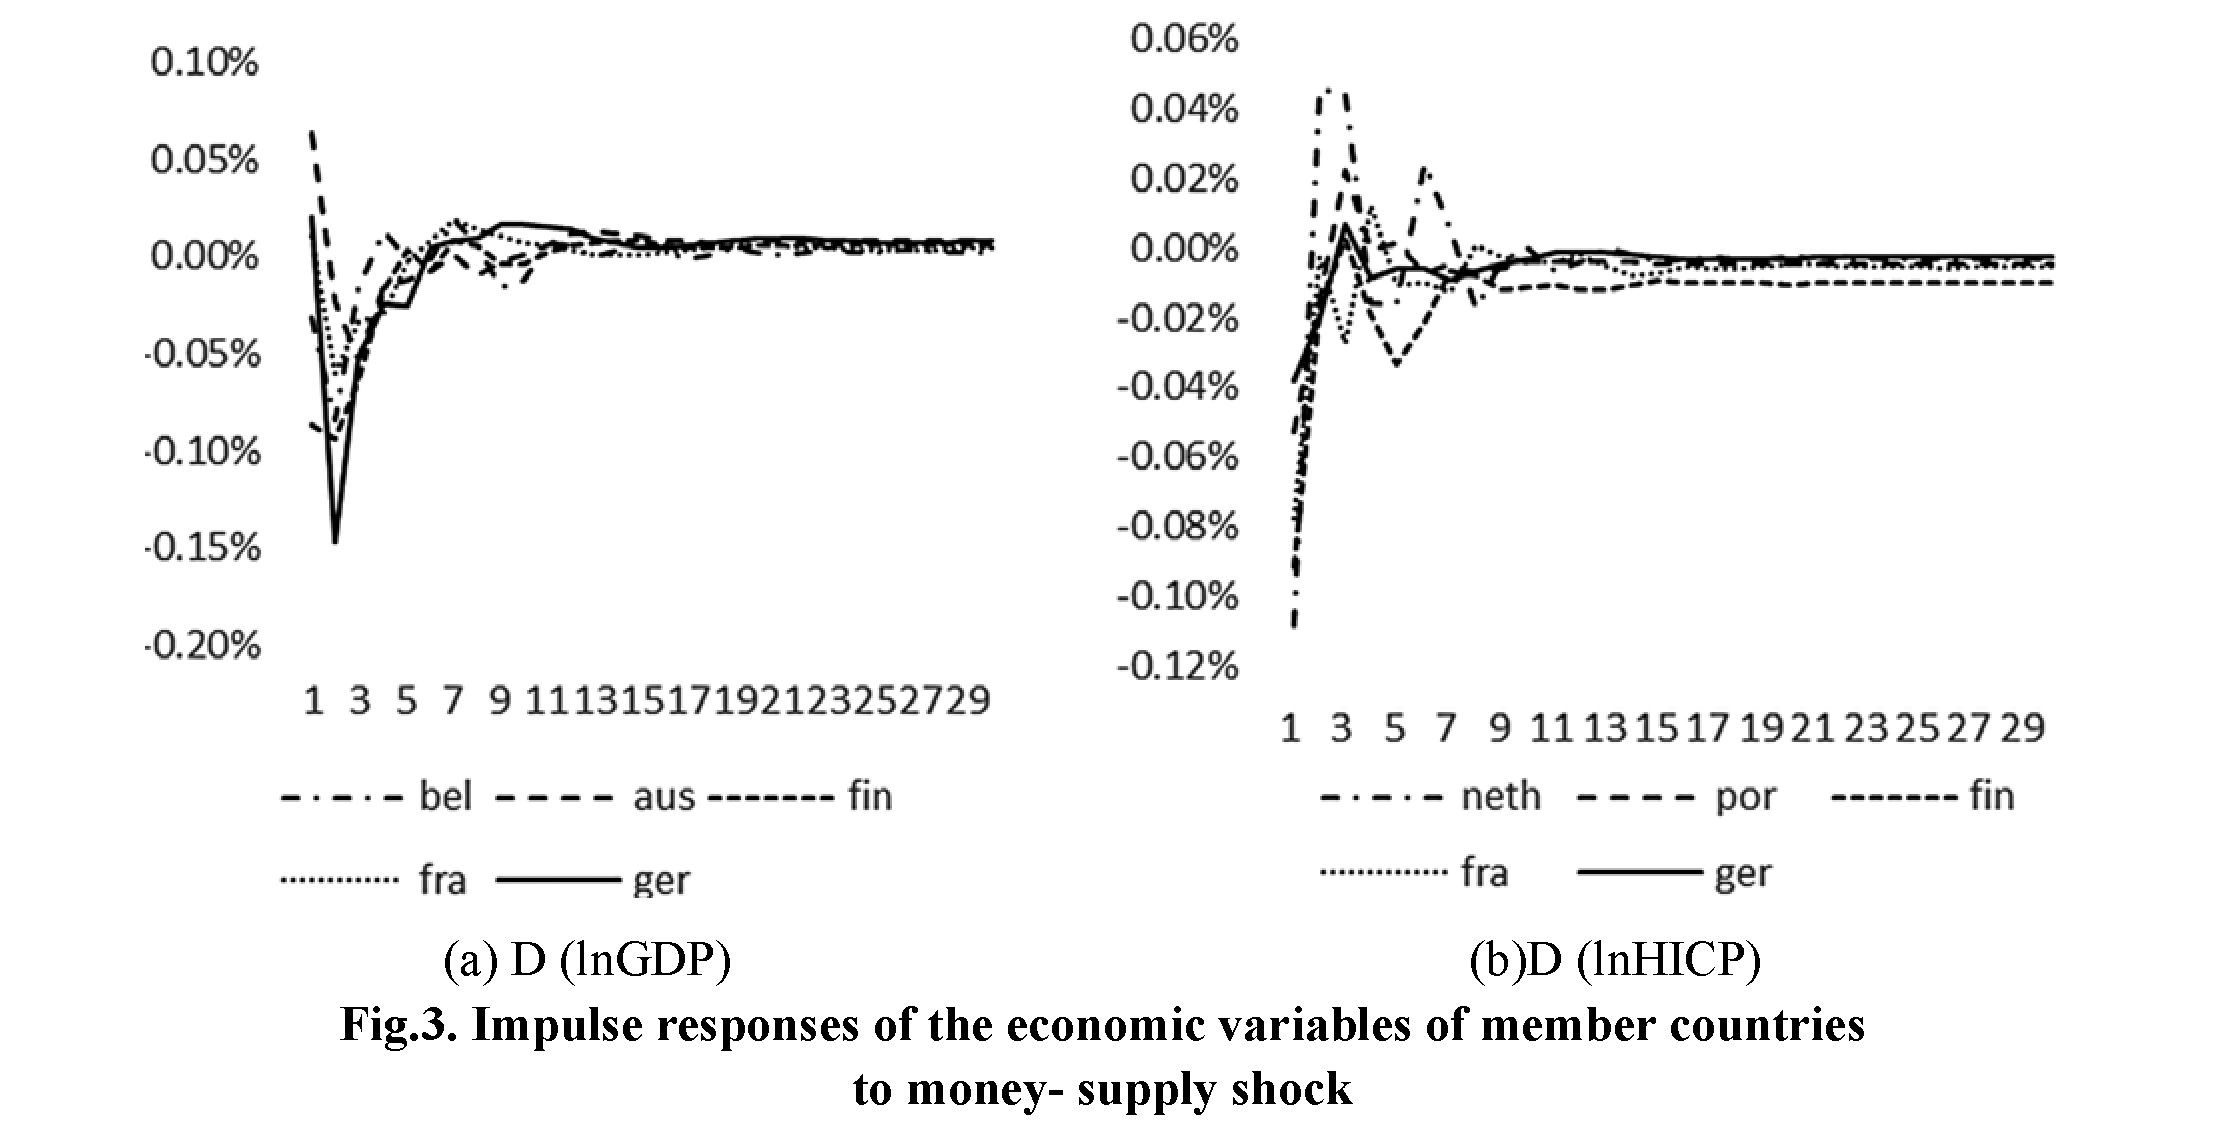
From the peak of impulse response, the sensitivity of economic growth of 13 euro-area member countries to the impact of money supply is far lower than that of long-term interest rates, and its peak value is between 0-2. There are some differences in the response of member countries' economic growth to M2 shock. Figure 3 (a) shows that Germany, Belgium and France had a negative response in the initial stage and reached the maximum response in the second stage. It shows that at this point in time, the increase in the money supply led to a decrease in
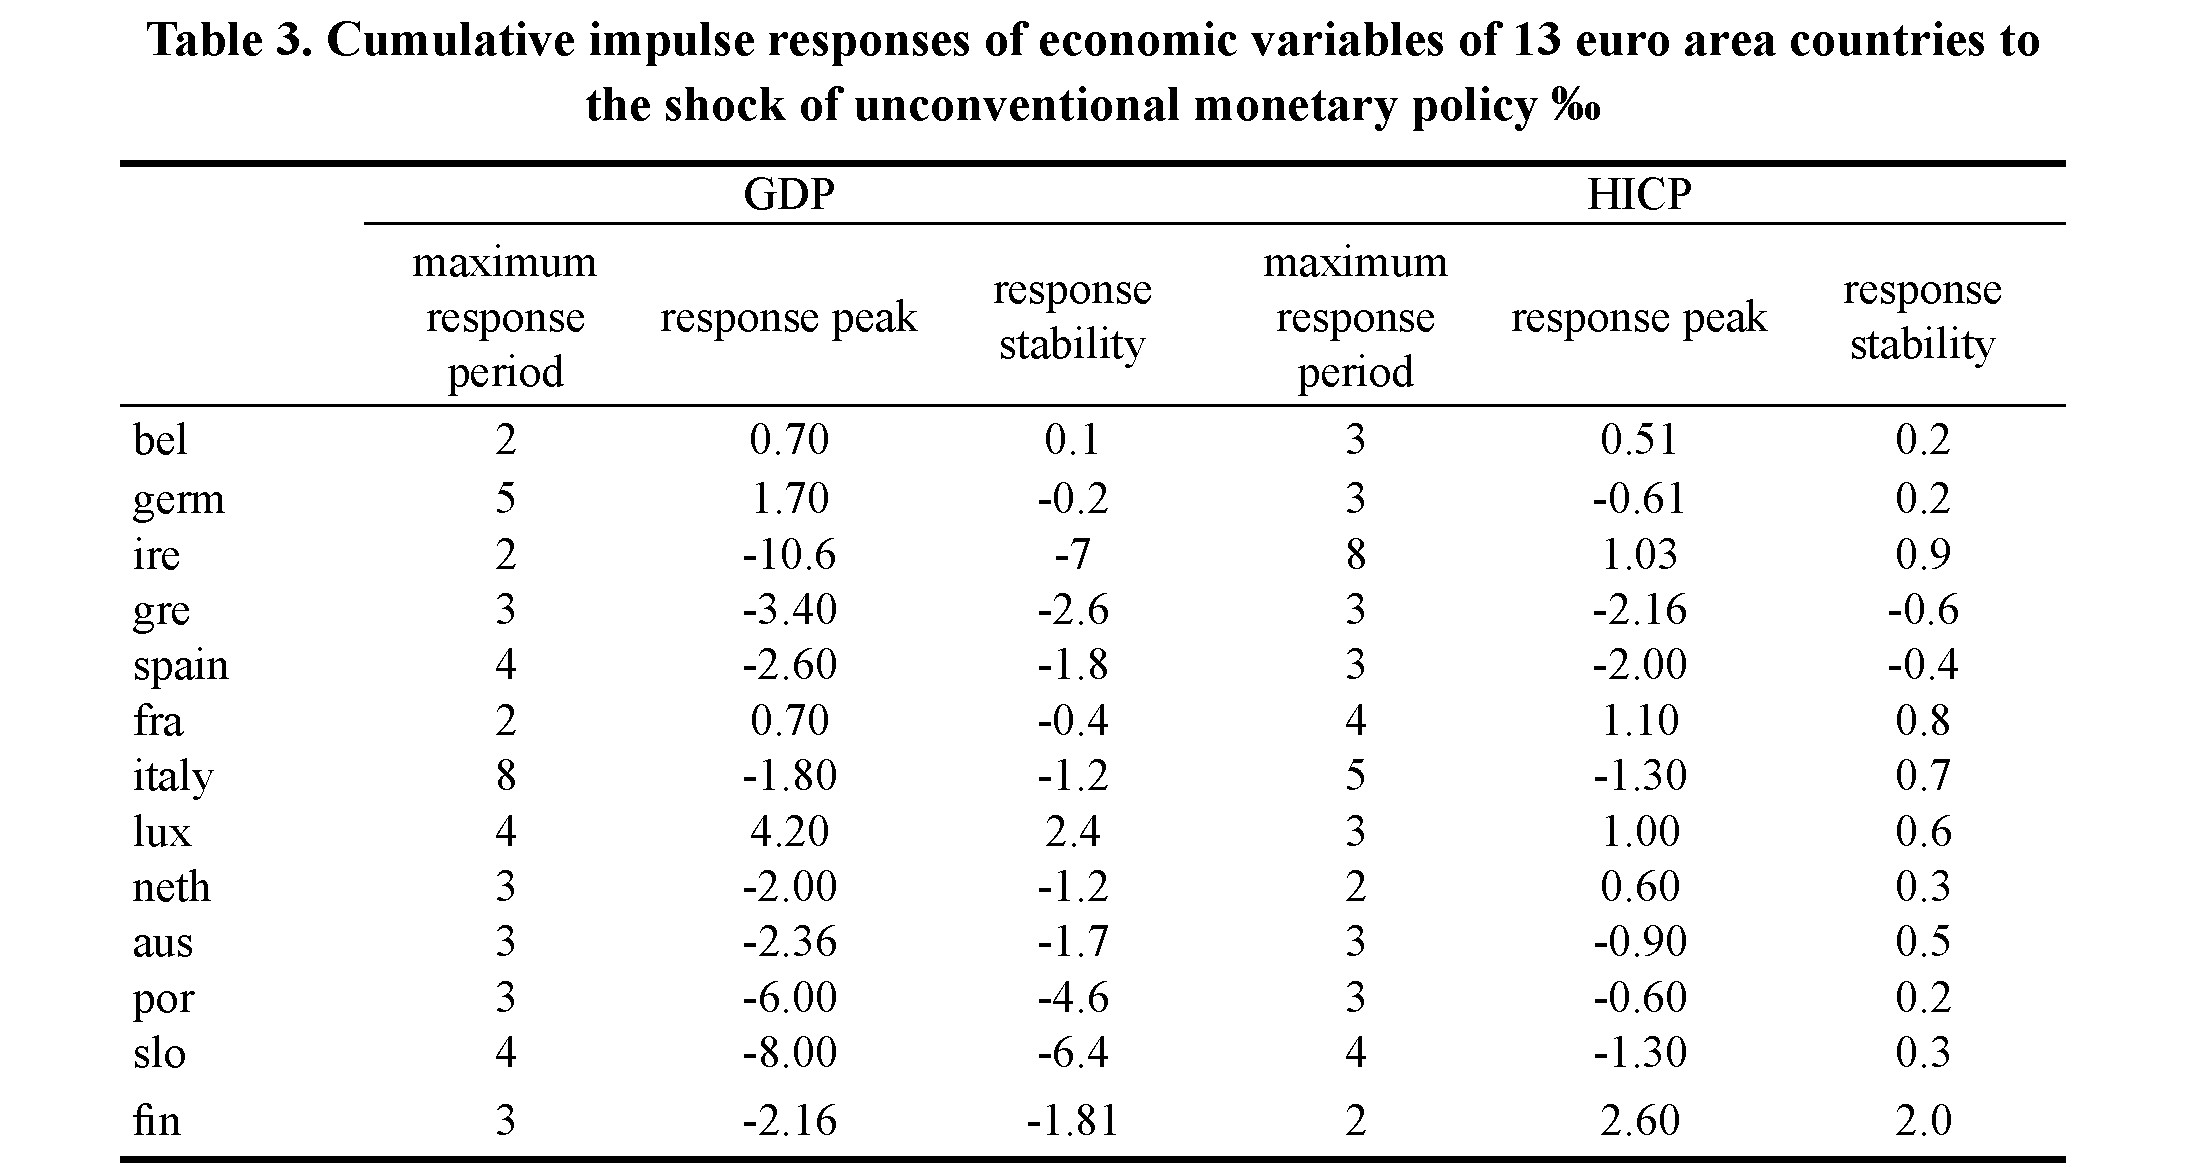
their domestic real income20; and then the negative response slowed down. Finland and Austria had a positive response in the initial stage, peaked in the first period and began to turn to a smaller negative response in the second period. Most countries have turned into a more stable positive response from the fourth period. Overall, the positive impact of economic growth in core countries on the impulse response to M2 shock is weak and this positive impact is short-term, and then converges to zero quickly.
The response of member countries' price level to M2 shock is also heterogeneous. For example, under the impact of a unit structure information of money supply, the maximum positive response of price level growth rate in the Netherlands and
Portugal exceeds 0.3 thousand points, while that in Germany, Finland and France is about 0.1 thousand points, only 1/3 of the former. Figure 3 (b) shows that the impact of money supply has a great negative impact on the growth rate of prices in France, the Netherlands and Portugal in the early stage, and then quickly turns to a positive impact with a decline and small fluctuation; Germany and Finland only show a small fluctuation at the beginning, from a negative response to a positive response and then to zero. The impulse response function of each member country tends to be stable after the seventh period. The change of money supply is effective in the short term and tends to be zero in the long term.
4.3. Testing of regional asymmetric effects under ESM
As a permanent international financial institution, the ESM plays a vital role in the member countries that have fallen into the debt crisis. While assisting member countries to get out of the sovereign-debt crisis, it will undoubtedly have an impact on the transmission effect of
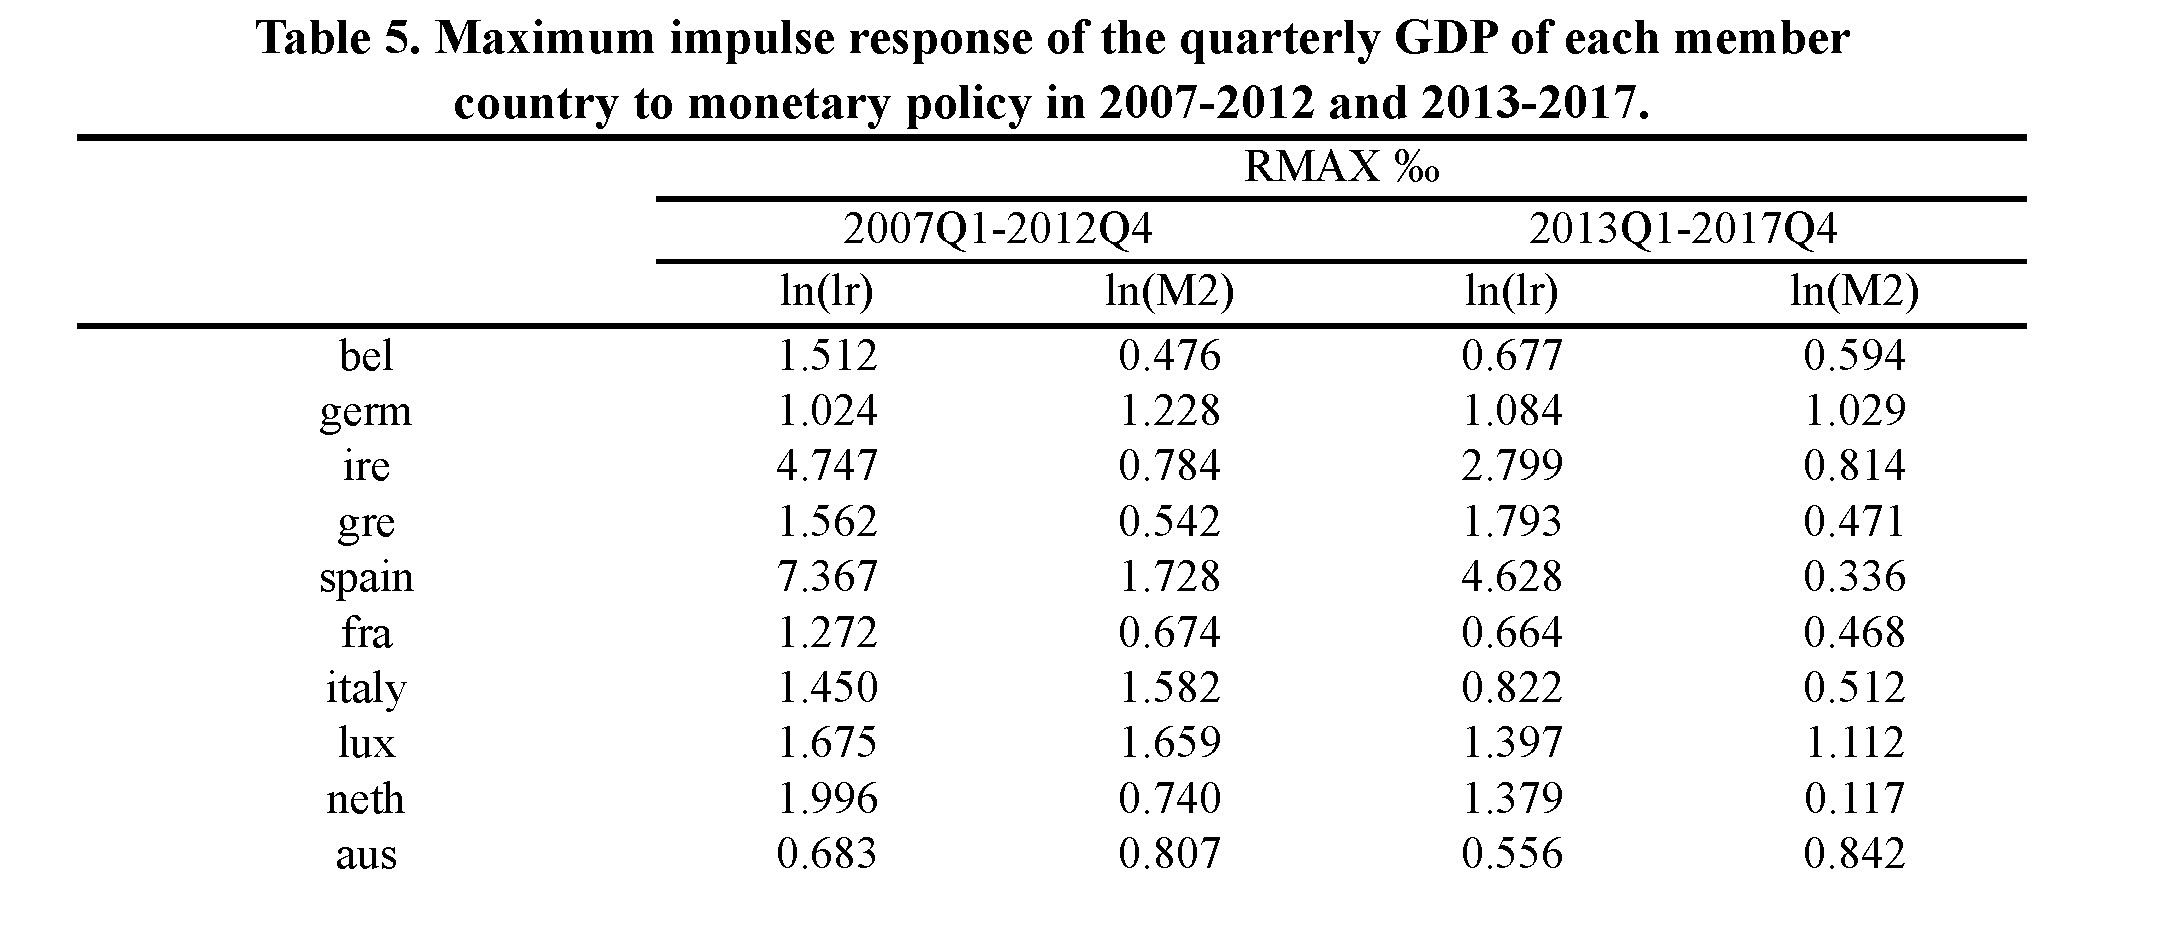
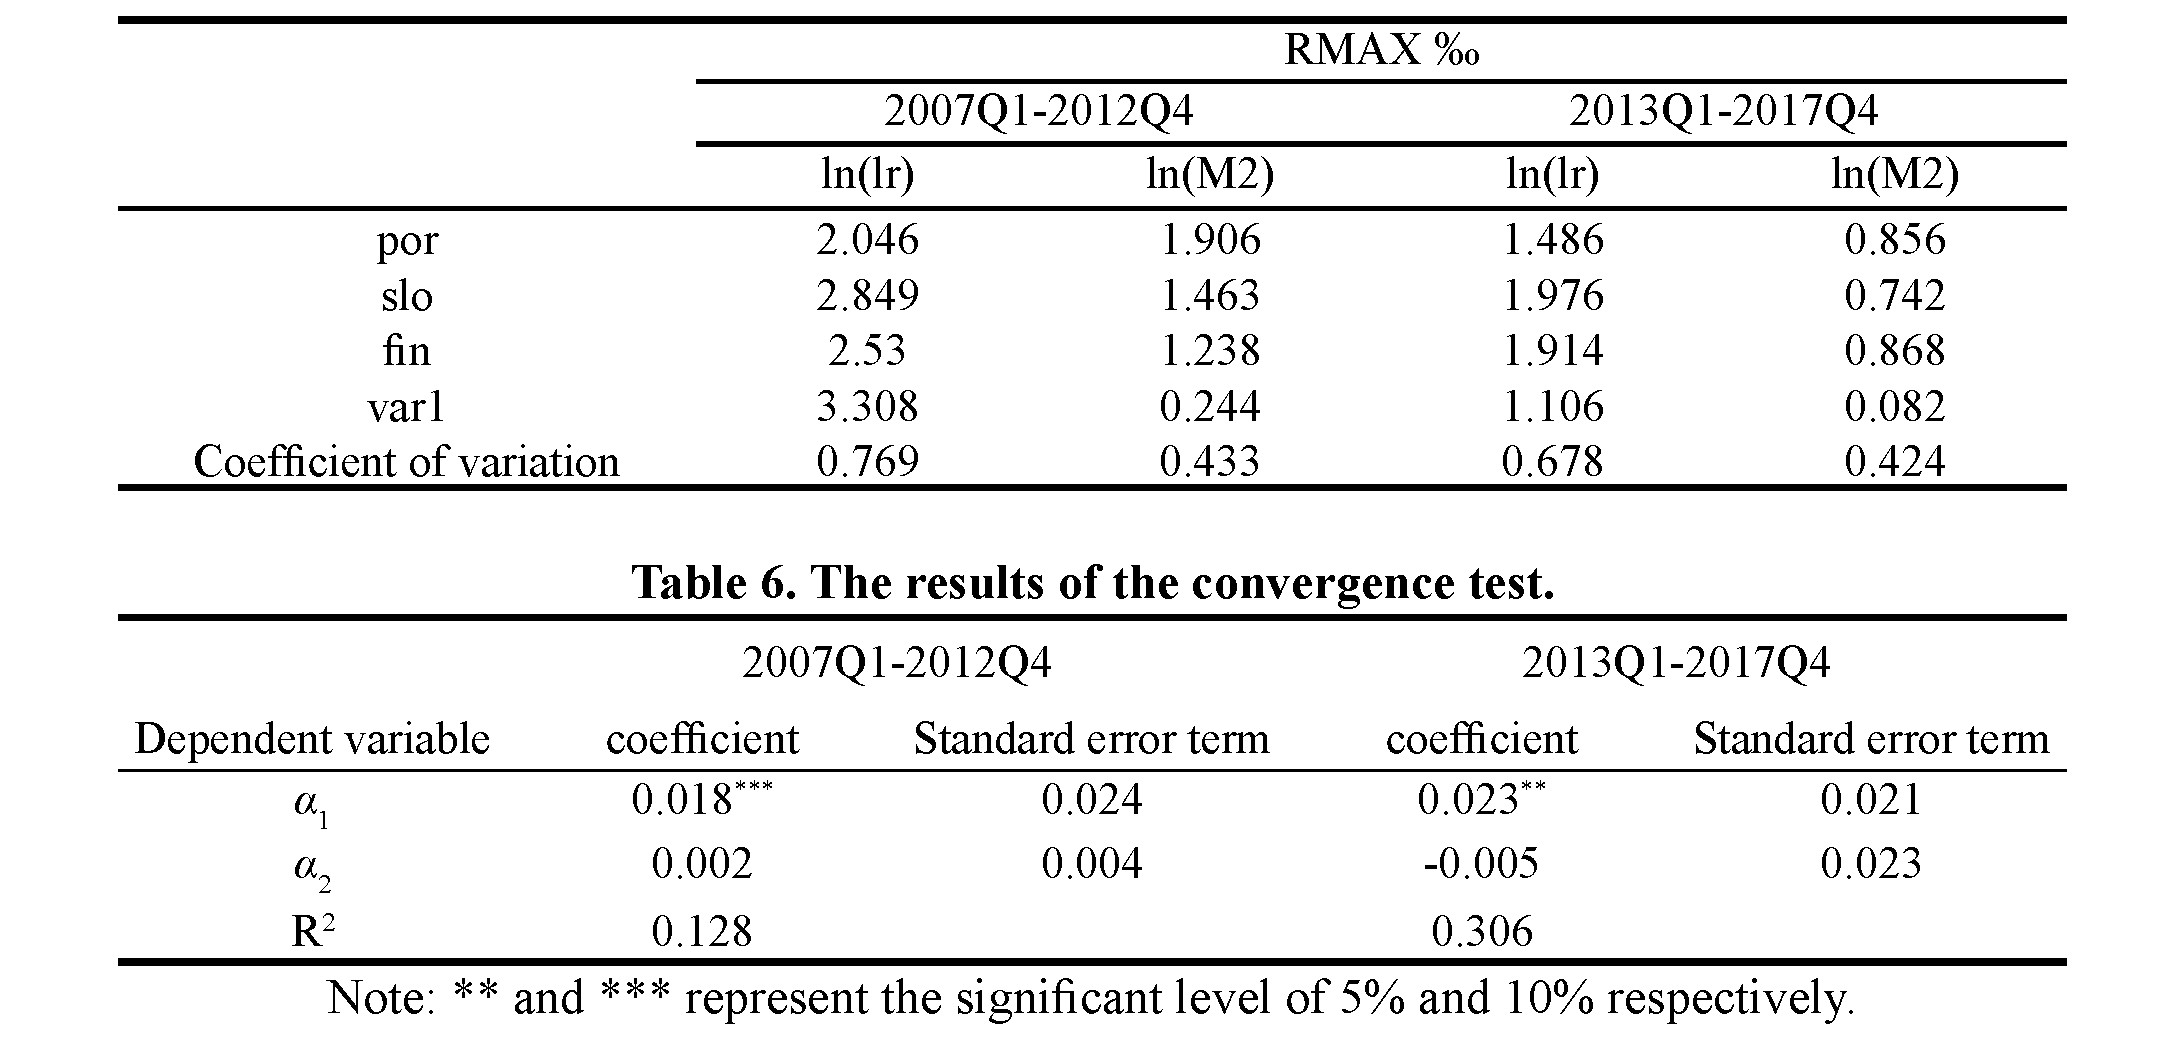
the euro area's monetary policy. To this end, we choose the maximum response of the actual GDP of member countries to the shock of unconventional monetary policy, taking the implementation of the ESM in October 2012 as the time boundary, the RMAX variance and coefficient of variation of the two periods of 2007 Q1-2012 Q3 and 2012 Q4-2017 Q4 were compared.
20 Due to the outbreak of the financial crisis and the sharp decline of the economy, the increase of M2 will not only promote consumption expenditure, but also increase production costs, offset the increase of national income, which is not enough to stimulate economic growth.
Firstly, the maximum response value (RMAX) of GDP to long-term interest rate (lnlr) and the maximum response value (RMAX) of GDP to money supply (M2) are calculated, according to the maximum response variance of each member country in the two periods, to compare whether the regional asymmetric effect of monetary policy is weakened under ESM. Secondly, this paper also adopts a α test method to analyze the convergence of regional effects of monetary policy in the euro area. Here we choose the response value of GDP to long-term interest rates to represent the response of member countries to monetary policy, in order to judge whether there is a gradual decrease in regional asymmetry of monetary policy in the euro area over time, specific formulas are as follows:

where D is the coefficient of variation of impulse response value among member countries, that is, the ratio of standard deviation of impulse response value to its mean value, α1 and α2 are all parameters to be estimated, μ is a random interference term. If α2 is negative and significant, it shows that the regional difference of monetary policy among member countries tends to reduce with time, i.e., α2 convergence.
It can be seen that the variance of the maximum response value (RMAX) of GDP to single monetary policy shock in 2012 Q1-2017Q3 is smaller than that in 2007-2012 (see Table 5).
Under the shock of long-term interest rate, the variance of the first stage (3.308) is greater than the second stage (1.106), and the coefficient of variation decreases from 0.769 to 0.678; under the shock of money supply, the variance of the first stage is 0.244, which is also greater than 0.082 of the second stage, and the coefficient of variation also decreases from 0.433 to 0.424 which shows no significant change; but in general, the asymmetric effect of the second stage is less than that of the second stage. The fiscal constraints of the EU weaken the regional heterogeneity of the single monetary policy.
At the same time, according to the results of convergence test (see Table 6), before the implementation of ESM, the time span coefficient was positive, which showed that the regional difference effect of monetary policy did not decrease with time before 2012. Since then, the corresponding time span coefficient is negative; but it has not passed the significance test, indicating that the asymmetry of member countries' response to long-term interest-rate shocks has a certain weakening trend. In addition, according to the variance comparison, it can be seen that member countries are more sensitive to long-term interest-rate shock than to money-supply shock. The interest-rate mechanism of unconventional monetary policy plays a stronger role: that is, the economic growth and price changes of member countries are more affected by long-term interest rates.
Using the sample interval of 13 member countries from the first quarter of 2007 to the fourth quarter of 2017, this paper introduces the central bank unit as a global variable into the model and establishes the MCSGVAR model. In the selection of the proxy variables of monetary policy, most of the existing literature adopts short-term interest rates or commodity prices. This paper makes improvements on this and chooses the yield of 3A 10-year Treasury bonds as the proxy variable to join the model. On the basis of completing the model estimation and related tests, using the GIRF to explore the heterogeneous effects of the ECB's unified monetary policy on the economic activities of 13 member countries in euro area where economic development is uneven and fiscal policy is different, and whether the asymmetric effect of each region is reduced under the EU's fiscal constraints.
The results of the study include: (1) The response trend of real GDP growth rate to monetary policy shock in member countries is basically the same, but the difference in response intensity is large. Greece, Spain, Ireland and other countries are affected by shock with high peak response. However, in the core countries with strong economic strength such as Belgium and France, the impact degree is relatively low; and, in the long run, the cumulative impulse response цof each country develops towards a stable trend; but there are significant differences between the stable period and the stable value.
(2) The impact of long-term interest rate shock on the economic activities of various countries is inconsistent and there is a time lag in the implementation effect. The economic growth and price changes in Germany, Finland and France have the fastest response to long-term interest rate shock. The response direction is roughly as follows: there is a fluctuation in a very short period of time, then it tends to be stable and the cumulative stability value is low, indicating that these countries have a stronger ability to digest the impact of shock; while small countries such as Ireland and Portugal have a higher cumulative stability value, which is more sensitive to long-term interest rate shock and have a longer duration of negative impact: they are less able to digest the impact of interest-rate shock.
(3) The sensitivity of member countries to long-term interest rate shock is greater than the sensitivity to the impact of money supply. The impact of money-supply shock on the price and output of member countries is not obvious. (4) Under the launch of the ESM, according to the variance comparison of RMAX value and α
convergence test, it is found that the regional asymmetric effect of ECB's monetary policy has been weakened. Under the unified monetary policy in the post-crisis era, it is of theoretical significance to promote fiscal union.
The asymmetric effect of ECB monetary policy in the member countries of the euro area indirectly reflects the unbalanced development of labor factors, financial market structure and industrial structure among member countries. The euro area is facing the reality of large disparities in economic development and inconsistent fiscal policies among member countries. The ECB formulates and implements monetary policy with the ultimate goal of price stability in euro area as a whole. It is impossible to formulate differentiated monetary policies based on member countries. The effect of monetary policy will inevitably lead to regional asymmetry due to their differences in economic conditions and fiscal policies of member countries.
This paper holds that in the post-crisis era, on the basis of optimizing the industrial structure of each member country, the introduction of fiscal union and the enforcement of fiscal constraints at the EU level will play a positive effect on alleviating the regional asymmetry of the single monetary policy in the euro area; and will help to promote the effective transmission of the ECB monetary policy and achieve monetary-policy objectives.
RefeRences:
- Ageliki A, Stephanos P, 2015. Regional asymmetries in monetary policy transmission: The case of the Greek regions. Environment and Planning C: Government and Policy.
- Arvind K, Annette V-J, 2011.The Effects of Quantitative Easing on Interest Rates: Channels and Implications for Policy. Brookings Papers on Economic Activity, Fall.
- Bernanke B, Reinhart V, Sack B, 2004. Monetary policy alternatives at the zero bound: An empirical assessment. Brookings papers on economic activity 2.
- Britton E J, Whitley, 1997. Comparing the monetary transmission mechanism in France, Germany and the United Kingdom: some issues and results. Bank of England, Quarterly Bulletin, May.
- Cai tongjuan, Jin shan, 2012. An Empirical Study on the Regional Asymmetric Effects of Single Currency Policy in the Euro Area: A Test Based on VAR Method. Studies of International Finance 6, 28-35.
- Carlino G, DeFina, R, 1998. The differential regional effects of monetary policy. Review of Economics and Statistics 80(4).
- Chen Anping, 2007. Research on the Regional Difference Effect of China's Fiscal and Monetary Policy. The Journal of Quantitative & Technical Economics 6, 56-64.
- Cover, James P., 1992. Asymmetric Effects of Positive and Negative Money Supply Shocks. Quarterly Journal of Economics 107.
- Elbourne A, De H J.,2004. Asymmetric monetary transmission in EMU: the robustness of VAR conclusion and Cecchetti’s legal family theory. CESifo Working Paper.
- Georgiadis, Georgios, 2015. Examining Asymmetries in the Transmission of Monetary Policy in the Euro Area: Evidence from a Mixed Cross — Section Global VAR Mode1. European Economic Review 75,195-215.
- Linda. A. Toolsema, Jan-Egbert S, Jakobde H., 2002. Convergence of pass -through from money market to lending rates in EMU countries: new evidence. CCSO/SOM Conference.
- Mundell R A., 1961. A theory of optimum currency areas. The American Economic Review.
- Peersman G, Smets F., 2001. The monetary transmission mechanism in the Euro Area: more evidence from VAR analysis. Mimeo.
- Pesaran M, Hashem, Til S, Scott M, Weiner, 2004. Modeling Regional Interdependencies Using a Global Error-Correcting Maeroeconometric Model, Journal of Business and Economic Statistics 22(02).
- Piazzesi M, Swanson, E T., 2008. Futures prices as risk-adjusted forecasts of monetary policy. Journal of Monetary Economics 4.
- Rafiq M, Mallick, S., 2008. The effect of monetary policy on output in EMU3: a sign restriction approach. Macroecon 30(04).
- Scott I., 1955. The regional impact of monetary policy. Quarterly Journal of Economics 69.
- Song Wang, Zhong Zhengsheng, 2006. The Existence and Origin of Regional Effects of Monetary Policy in China——An Analysis Based on the Theory of Optimum Currency Areas. Economic Research Journal 3, 46-58.
- Ueda K., 2012. The Effectiveness of non-traditional monetary policy measures: the case of the bank of Japan*. Japanese Economic Review 63(01).
- Woodford M., 2010. Financial intermediation and macroeconomic analysis. The Journal of Economic Perspectives.
- Xavier G, Arvind K, Olivier V., 2007. Limits of Arbitrage: Theory and Evidence from the Mortgage-Backed Securities Market. Journal of Finance 2.
- HUNG Jialin, QIN Fengming, 2017. Regional Asymmetries in the Effects of Monetary Policy in China Evidence from a Mixed Cross—section Global Vector Autoregression Model. Journal of Financial Research 12, 1-16.
- Zhang Hong, Li Yang, 2013. Research on Regional Differences of Transmission Effect of Monetary Policy in Real Estate Market——An Empirical Analysis Based on GVAR Model. Journal of Financial Research 2,114-128.
- Zhang Hong, Li Yang, 2014.The Dynamic Impact of China's Economic Growth on International Energy Consumption and Carbon Emissions——An Empirical Study Based on GVAR Models in 33 Countries. Journal of Financial Research 1, 14-25.
- The article was first published in the proceedings of the International Conference "National Modernization Strategies: Achievements and Perspectives" - KazISS under the President of RK, 2018, pp. 58-68 ↑
- The article was first published in the proceedings of the International Conference "National Modernization Strategies: Achievements and Perspectives" - KazISS under the President of RK, 2018, pp. 82-86 ↑
- The article was first published in the proceedings of the International Conference "National Modernization Strategies: Achievements and Perspectives" - KazISS under the President of RK, 2018, pp. 87-91 ↑
- The article was first published in the proceedings of the International Conference "National Modernization Strategies: Achievements and Perspectives" - KazISS under the President of RK, 2018, pp. 92-100 ↑
- The article was first published in the proceedings of the International Conference "National Modernization Strategies: Achievements and Perspectives" - KazISS under the President of RK, 2018, pp. 181-186 ↑
- The most important component of civil socialization is professional socialization, the foundations of which are laid in the system of vocational and higher education. Legal socialization is inextricably linked with civil socialization, the goal of which is not only legal education, deep assimilation of legal norms in all spheres of life, but also the formation of a sense of law and legitimacy, lawabiding behavior, upholding and protecting the rights of every citizen. ↑
- Exponential growth is an increase in magnitude when the growth rate is proportional to the value of the magnitude itself. ↑
- The concept of “cultural imperialism” was widely adopted after the UNESCO conference held in Mexico in 1982, at which the problems of cultural policy were discussed. ↑
- Media imperialism is a model of dependent relations based on exports from developed countries, primarily the United States, of large amounts of information, communication equipment and software, which indirectly establishes a number of foreign norms, values and expectations that change the internal culture and socialization processes. ↑
- Network-centric influence is the forms and methods of global influence of certain groups of supranational (non-national) character, based on the possibilities of the phenomenon of global open network structures. ↑
- Analytical note “Politics of civil socialization of youth in Uzbekistan at the present stage: search for new approaches”, Tashkent, CER, p. 9 ↑
- The article was first published in the proceedings of the International Conference "National Modernization Strategies: Achievements and Perspectives" - KazISS under the President of RK, 2018, pp. 87-91 ↑
- The article was first published in the proceedings of the International Conference "National Modernization Strategies: Achievements and Perspectives" - KazISS under the President of RK, 2018, pp. 118-126 ↑
- Liquidity trap: A hypothesis put forward by Keynes that when interest rates fall to a point where they cannot be further reduced, the increase in money supply will not stimulate consumption and expenditure, nor will it affect overall demand. ↑
- The ESM is funded proportionally by member countries of the euro area, with 80 billion euros of paid-in capital and 620 billion euros of notified paid-in capital. The main task is to provide financial assistance to member countries under strict conditions and to improve the ability of recipient countries to raise their own capital from financial markets. ↑
- Using Eviews 9.0 to eliminate seasonal effects and more accurately grasp quarterly changes in economic variables. ↑
- Source of trade flow data among member countries: https://comtrade.un.org/data. ↑
- Processing software is MATLAB 2014. Unit root test uses Augmented Dickey (ADF) test and Phillips-Perron (PP) test. First, the horizontal value of P is not significant, and it is a non-stationary sequence. Then, the first-order difference is made. At this time, there is no time trend term in the autoregressive model, and the sequence is a stationary sequence at 5% significance level. ↑
- The processing tool is GVAR-Toolbox 2.0. The trace test is superior to the maximum eigenvalue test when the number of samples is not large and the perturbation term does not obey the normal distribution. ↑
- Confidence interval: 95% asymptotic confidence interval, for the horizontal impulse response function, converges to 0; for the cumulative impulse response function, the corresponding interval converges to a fixed distance. ↑