This article is devoted to modelling of contamination of air medium of industrial center evolve three phylum of sources of influence: the industrial enterprises, motor transport and private sector. In this article process of mapping of contamination of air basin by the industrial exhausts, leading the greatest contribution to contamination of city air is described on the example Karaganda. Exhausts from the industrial enterprises are considered as set of point sources, each of which has the characteristics on frame and volumes of exhausts. The chosen mathematical model calculating diffusion of pollutants in atmosphere is based on use of the equation of conduction. Prevalence of pollution for enterprise limits is predicted. The Gauss model is used at calculation of dispersion of admixtures in the conditions of local weather conditions. The forecast of volume of concentration of contaminants in a ground layer of a free air is carried out.
In this article is determined one of the methods of ecological mapping of aerial contamination Karaganda-Temirtau industrial regions. Atmosphere as is characterized the most dynamical medium by complex existential dynamics of levels of impurity level. In this connection for exposure contaminations in such dynamic medium in yielded article are used a mathematical model of Gauss. It is revealed that the mathematical model spread disperse particles is one of most convenient mathematical models for calculation of contamination depending on distance, having shown good efficacy and simplicity in calculations.
Environmental conditions, which worsens with each decade of the active industrial activity of the person makes, look for more and more committed by methods of observation of environmental surround.
Human`s need to control of ecological environment has led to the development of the new major direction of thematic cartographyenvironmental mapping. A variety of thematic content of environmental cards due to the area of their practical application (biological, geological, medical, social science, etc.) [1]. For the environmental mapping of interest are objects, the role of the environment for which plays a geographical shell of the Earthcomplex multicomponent system, each component of which is determinant of form and the state of all other components, as they are all interdependent and interact with each other. Therefore, one of the fixed assets in the graphical modeling of the natural environment for the problem solving the regulated nature is the environmental mapping.
The atmosphere as the most dynamic environment is characterized by a complex spacetime dynamics of the levels of the content of impurities. In each given time the level of contamination of the atmosphere over a certain territory or in one or another point is determined by the balance on individual parameters soand their aggregate. In a base of the balance are [2, 3]:
- receipt of pollutants from the aggregate anthropogenic and natural sources within the considered the territory;
- receipt of pollutants from sources of outside the considered the territory, including remote(far the transfer);
- the formation of pollutants as a result of the secondary chemical processes in the most In the expenditure balance are:
- takeout of pollutants beyond the considered the territory;
- deposition of pollutants on the earth surface;
- the destruction of pollutants as a result of processes of self-
Mapping sources of air pollution is carried out on the basis of data inventories, statistical reporting volumes of emissions and generalizing materials. These inventories get in the development of materials of environmental regulation on the general plans of enterprises in the scale 1: 500 — 1: 5000. At the same time is shown planned the position of emission sources included in the inventory, and their numbers through the list. Characteristics of sources (name, the specific emissions of individual corpuscles in g/s, operating mode source) is given in the table materials and is used for calculations of the scattering of the maximum onetime of emissions.
At mapping of contamination of air medium, there is a necessity of fast processing of a considerable quantity of the various information. Depending on degree of complexity of a mathematical model applied, thus the quantity of input parameters can strongly be varied. Attraction of more exact models involves introduction of new phylum of the data. Use of tools modern GIS allow to computerize processing of the necessary initial information and to receive results with the high existential permission [4].
Generally all initial data for mapping of contamination of air basin of an industrial city can be broken into three basic phylum:
- the data on frame and volumes of exhausts, phylum and properties of sources of the contamination adhered to a card;
- the data on conditions of diffusion the contaminations including the meteorological data, boundary conditions for meteorological fields;
- the data about a relief and properties of a spreading surface over which there is a contamination conduction (a roughness, albedo, ).
All process of building of cards of contamination with use of GIS-TECHNOLOGIES can be broken into some stages.
At the first stage the cartographical basis is prepared. It represents a panel of thematic beds which, first, contain the initial information for modelling (a locating of sources of contamination, the relief, a landscape), secondly, reflect the information necessary for the analysis of results and reception of a definitive card of contamination. At this stage the dimensions of area corresponding to a task in view are defined. The database on contamination sources is prepared. The binding of the data to a card is manufactured.
The second stage includes direct preparation for modelling. As the data about meteorological fields, a relief and properties of a spreading surface represents impure sizes on space, for numerical modelling of contamination which is made, as a rule, on some regular grid, continuous on space the data of this kind is led to a discrete kind. For this purpose the necessary information is represented in a kind of grid — that (grid) which receive as a result of processing of initial vector beds. At this stage of preparation of the data the modern tools, GIS are involved, allowing the computerizing processes of transformation and generalization of the pristine information on a card.
The third, the closing stage, includes carrying out of calculations on model. The calculated fields of concentration of pollutants are represented in a kind of grids. At this stage finish machining of results and reception of cards of an assessment or the contamination forecast is manufactured.
At modelling of contamination of air medium of industrial center evolve three phylum of sources of influence: the industrial enterprises, motor transport and a private sector. In yielded article, on an example Karaganda, process of mapping of contamination of air basin by the industrial exhausts leading the greatest contribution to contamination of city air is described. Exhausts from the industrial enterprises are considered as set of point sources, each of which has the characteristics on frame and volumes of exhausts. The chosen mathematical model calculating diffusion of pollutants in atmosphere is based on use of the equation of conduction.
On an incipient state of preparation for work was it is taken satellite image in scale 1:500 000, Karaganda-Temirtau of an industrial zone. For an assessment of degree of contamination of air basin generally it was necessary to receive following thematic beds:
- the rivers and reservoirs (area) — a theme including polygonal aqueous objects;
- the rivers (line) — a linear theme where linear objects in scales of investigated terrain represent the small rivers, streams and canals;
- a green region — the polygonal theme including in the form of objects gardens, woods, parks;
- moors — representative enough polygonal theme for vicinities of Barnaul on which suburb the river Ob with sets a duct proceeds;
- horizontals of heights — the polylines displaying the information on a relief;
- city quarters the polygonal theme representing either inhabited, or industrial quarters of a city;
- separate constitutions — set of the small polygons describing settlements, summer residences and other leaky buildings;
- roads — the linear theme, which objects are either the railways, or highways of a various category having various phylum of a road
As a result of numbering and the subsequent transformation of co-ordinates the basic panel of thematic beds in geographical co-ordinates on area (a square with the side of 30 km), covering region and its vicinities has been received.
As the initial information on contamination sources was the joint-stock company database of «Arselor Mitall» is taken. On each source of contamination, there was an information on diameter and tube height, volumes, speeds, temperature and chemical composition of exhausts [5–6]. After a binding of base to a used card the additional point coating which objects corresponded to a site of industrial tubes has been received.
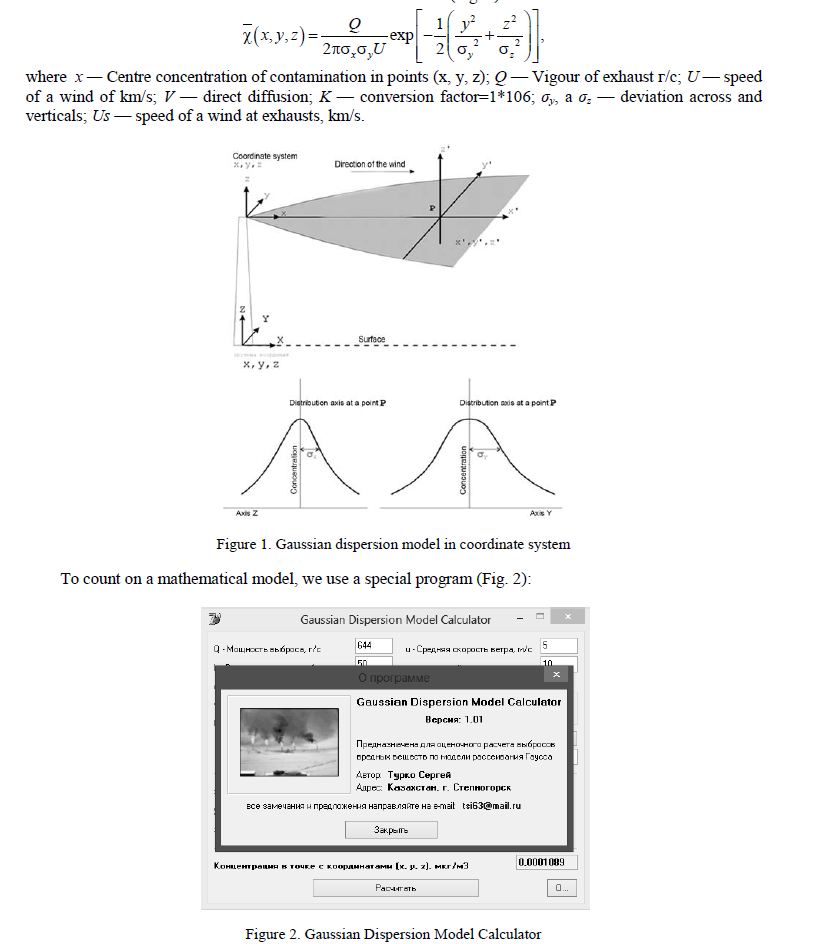
In offered work the mathematical model of Gauss is used (Fig. 1). This formula:


The proposed technology mapping showed its practical effectiveness, and can be used for various tasks estimation of anthropogenic impacts on the environment.
References
- Struman V.I. Ecological mapping: train aid., Moscow: Nauka, 2003, p.
- Zhetpisov S.U. Geoecological problems of Karaganda-Temirtau of industrial district and way of their decision: dissertation, Almaty, 2002, p. 5–16.
- Shumova O.V. Ecology-geographical mapping on the basis of aerospace information: the methodical manual, Saint Petersburg: Publ. SPb University, 1998, p. 21–43.
- Seitkaliyev I.O. XVII the Student international research and practice conference, Novosibirsk,
- Statistical collection, Ser. the 16, Natural resources and guard of environment. About the state of guard of atmospheric air in the Karaganda area, Karaganda: The Department of Statistics of the Karaganda area, 2000-2012, p. 37–40
- Zhakatayeva T. Materials of international scientific conference devoted to the 80 year of Ye.А.Buketov, March, 23–24, 3, Karaganda: Publ. КSU, 2005, p. 283–286.
- Zhakatayeva T. Messages of the Ust-Kamenogorsk branch of Kazakh geographical society, Ust-Kamenogorsk: Publ. house red.-ed. Council Ust-Kamenogorsk branch of the Kazakh Geographic Society Islands, 2009, 2, p. 142–154.
- Vorobiov К.V., Мironenko V.F., Scirokova S.L., Yakovshenko S.G., Postnova I.S. DEVICE for steady development of territories: materials to the International conference hybrid-type, June, 1999, 3,Yakutsk: house Sahapechat, 1999, p. 154–161.
- [ER]. Access mode: http://www.moluch.ru/conf/tech/archive/4/895.
- About the state of guard of atmospheric air in the Karaganda area in 2007, 16. Management of statistics of the Karaganda area, Karaganda: Karaganda region Department of Statistics, 2008, p. 23–25.
- Data state hydro achievement on contamination of atmospheric air city of Karaganda for 1998–2012, [ER]. Access mode: http://www.kazhydromet.kz.
- of Agency of the Republic of Kazakhstan on statistics for 2008–2012. About the state of guard of atmospheric air in the Republic of Kazakhstan, 1, Sources of extras of contaminants in atmosphere, 16, Guard of environment, Astana: Publ. House of the Statistics Committee of the Ministry of National Economy of the Republic of Kazakhstan, p. 93–124.