It is emphasized that the main indicator characterizing level of living of the population is the total income. Analyze changes in the structure of household income in Armenia. It is emphasized that these processes significantly differ on urban and rural population of the country. It is proved that the ongoing process of change in the structure of aggregate household income countries shows the positive results of the formation of market relations in Armenia. It is noted that for the studied period of time in Armenia a certain work on decrease poverty of the country population was carried out. It is proved that the tendency to polarization of society into rich and poor can be graphically represented using the Lorenz curve
The basic indicator characterizing the living standards of the population is the total income. This factor includes both all money returns and money expression of all consumption goods of domestic production and nonfood products and services provided free of charge by other people or relatives.
Between 2004–2009, there were a lot of changes in the area of the household income structure of Armenia. Thus, the unit weight of monetary income in the structure of total income in 2004 increased from % to 8 % in 2009, and the share of natural returns decreased respectively from 14.3 % to 8.2 %. However, this process is significantly different in terms of urban and rural population of the country. Hence, if the unit weight of the household monetary income in the urban areas in 2004 grew from 93.1 % to 96.8 % in 2009, in rural places it went up from 71.6 % to 80.6 % (Table).
This process of change in the household total income structure of the country, as a whole, comes to show positive results in the formation of the market relations in Armenia. Nevertheless, the latter indicates the deceleration of this process in rural areas and insufficient development of the market relations in the country's agriculture. However, during the analyzed period of time, significant contributions were made to the reduction of the population poverty level. If in 2004 41 % of the country's population was poor or extremely poor, in 2008, the figure already reached 26.6 %. Still, in 2009 the unit weight of these categories increased to 33.9 %.
The aggravation of the population poverty level, as a matter of fact, was caused by the global financialeconomic crisis that influenced the economy of the country. In fact, the crisis affected more the urban population (except the city of Yerevan) and was less tangible for the population of Yerevan and rural areas where the living standards are higher.
Still, the analysis of monetary income dynamics of the population layers with the lowest, highest and average incomes by decile groups for the analyzed period of time gives a more complete notion of the poverty level of the Armenian population.
T a b l e
The structure of the household monetary Incomes of the RA according to decile groups in 2004 and 2009, %
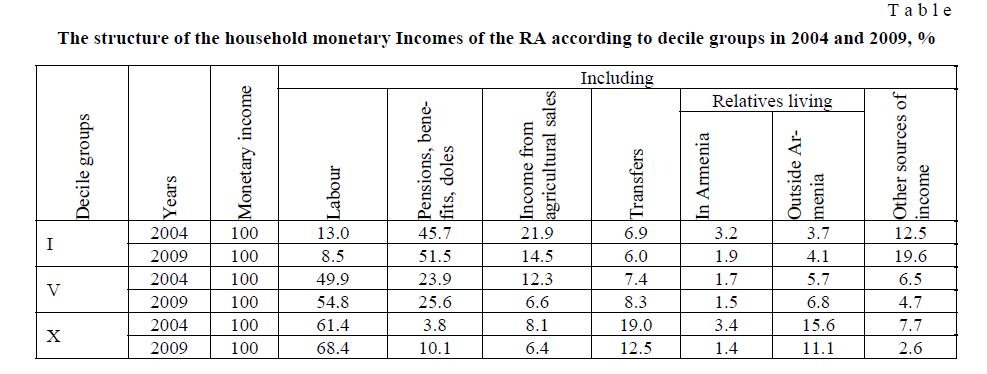
According to the data in the table, the basic sources of the increase in the living standards for the average layer of the population in the RA in 2004–2009 were labour income, state social transfers nd transfers from relatives overseas. Namely, such factors as labour, the social policy conducted by the government and labour migration accounted for the most increase in he monetary income. In the given social-economic situation, such kind of dynamics can be considered quite posit ve. The picture mainly remains the same when analyzing the dynamics of monetary income structure for 10 % of people with the highest income. Labour income and state social transfers are the main sources for the increase of living standards for this population category in 2004–2009, as is also the case with the average population layer. The difference is that the proportion of transfers from both the overseas relatives and those living in the RA has significantly decreased which, considering the present global financial-economic crisis, is quite appropriate.
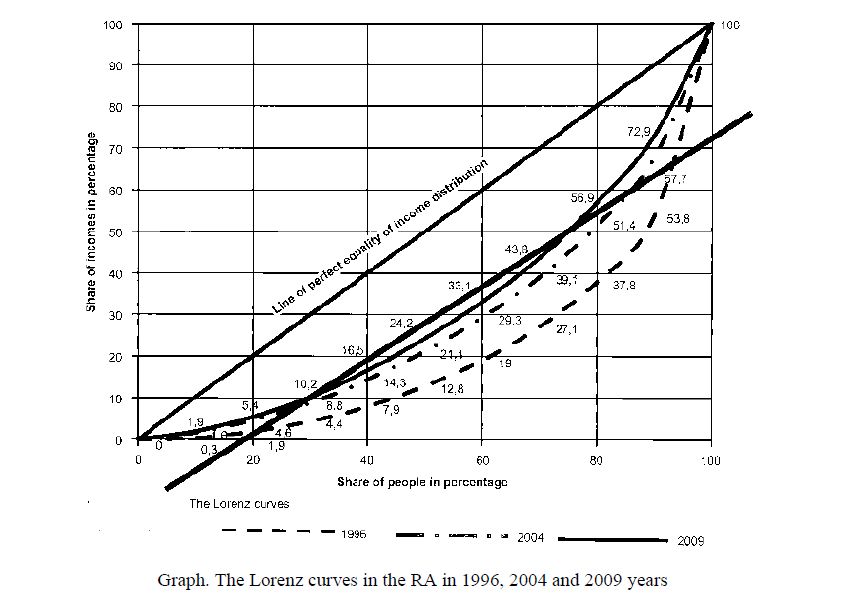
Graph. The Lorenz curves in the RA in 1996, 2004 and 2009 years
Nevertheless, the picture drastically changes when we analyze the dynamics of monetary income structure for 10 % of the layer of the Armenian population having the lowest income.
Hence, already extremely little portion of labour income decreased from 13 % in 2004 to 8.5 % in 2009. The share of state social transfers grew to 51.5 in 2009, the share of the transfers from relatives living outside the RA and other sources of income from 12.5 % in 2004 reached 19.6 % in 2009. It should be mentioned, that the latter probably proves that these population layers do unauthorized work with concealed pay. This range of household should first of all include families on doles, one-parent families, the retired, the unemployed, the disabled, students, as well as hired workers with no or low qualifications. In this respect, it seems quite appropriate to provide a rapid growth rate of minimum salaries in order to increase the labour income for this layer of the population. Income tends to meet the standards of justice providing that their differentiation, first of all, is related to the labour pay differentiation [1–5].
The tendency towards the polarization of the rich and the poor in 1996–2009 may be graphically illustrated by the Lorenz curve. The inequality of income distribution by the Lorenz method is represented in the graph with the help of the curve, characterizing the deviations in the income distribution from the line of abstractly probable perfect equality of distribution. The character of the curve concavity reflects the level of the income distribution inequality for the various levels of the population.
As graph 1 shows, the Lorenz curve in 1996 reflects the growth of population income distribution with the start of market reforms. However, after the completion of the first stage of the market reforms and the stabilization of the RA economy, in 2004 there is a substantial improvement in the population income distribution. Later, this positive tendency somewhat weakens, which gives the Lorenz curve smoother outlines in 2009.
Hence, over the past decade the policy in the area of population income distribution conducted by the RA government has allowed the Lorenz curve to significantly move toward the perfect line equality of income distribution.
References
- Statistical Almanac of Armenia 2001 (1999, 2000), Yerevan, NSS, RA, 2001, p.
- Statistical Almanac of Armenia 2009, Yerevan, NSS, RA, 2009, p.
- Statistical Almanac of Armenia 2010, Yerevan, NSS, RA, 2010, p,
- Social Image of Armenia and Poverty. Statistical-analytical report (in Armenian), Yerevan, 2009, p.
- Social Image of Armenia and Poverty. Statistic analytical report (in Armenian), Yerevan, 2010, p.