Current diabetes treatment relies primarily on hemoglobin A1C measurement to assess quality of glycemic control and to adjust therapy. Recent studies have revealed that A1C has some important limitations, and it conveys a rather complex message. This has to be taken into consideration for adjustment of diabetes therapy. To significantly improve diabetes treatment, both key metrics for glycemic control on a day-to-day basis and more advanced monitoring methods are needed. In addition to traditional discontinuous monitoring methods, continuous glucose sensing has become an indispensable tool to reveal insufficient glycemic management in patients with complicated diabetes. Several continuous glucose monitoring (CGM) systems, which have shown usefulness in clinical practice, are currently on the market. The widespread clinical application of CGM is still hampered by the lack of generally accepted measures for assessment of glucose profiles and standardized reporting of glucose data.
Since landmark studies have provided evidence that hemoglobin A1C (A1C) is linked to vascular complications of diabetes [1, 2], current glycemic management is mainly based on measurement of A1C. Optimal diabetes control aims to restore levels of A1C to as normal as possible to reduce or prevent diabetic complications. However, recent studies have revealed that A1C has some important limitations, and represents a rather complex measure of glucose metabolism. A1C is a marker for overall glucose exposure and integrates both fasting as well as postprandial hyperglycemia but their relative contribution varies with the quality of glycemic control [3]. The increased cardiovascular risk observed in patients with type 2 diabetes is only partly explained by traditional cardiovascular risk factors. It is well known that chronic sustained hyperglycemia increases the risk for microvascular complications in type 1 diabetes and the cardiovascular risk in type 2 diabetes. Especially postprandial hyperglycemia, independent of A1C or fasting glucose, has been associated with cardiovascular disease [4], and this could be confirmed very recently in a post-hoc analysis of the «Effects of prandial versus fasting glycemia on cardiovascular outcomes in type 2 diabetes (HEART2D)» study [5].
It is generally accepted, and as laid down in the American Diabetes Association and IDF guidelines, that strict glycemic control, implicating a comprehensive diabetes evaluation, is needed to prevent or delay diabetes complications. The outcomes of the ACCORD [6] and ADVANCE [7] trials have taught us that A1C levels should be tailored to the patients´ health status extensive comorbid conditions require less stringent targets. Now, time has come to accomplish measurement of A1C by other markers of glycemic control, allowing for assessment of shorter-time changes in glycemia.
Although self-monitoring of blood glucose (SMBG) is still the predominant mode of glucose monitoring, the use of advanced technology such as continuous glucose monitoring (CGM) has shown remarkable benefits and expanded signifycantly during recent years. One major problem in utilization of CGM is appropriate evaluation of the great amount of data provided by CGM systems and the lack of standardization.
The purpose of the present review article is to give an insight into the problems of choosing the most relevant markers of glycemic control and how to evaluate CGM data properly to optimize management of diabetes.
Markers of glycemic control
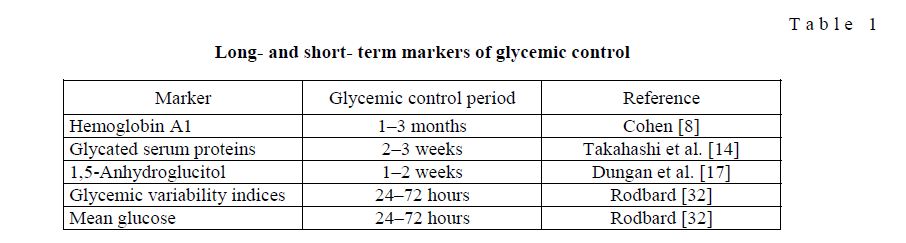
Several markers of glycemic control have been used in routine practice as well as in clinical trials to guide therapy and to investigate the efficacy of therapeutic agents on patients´ glycemic control. A comparison of validated markers is shown in Table 1.
Longand shortterm markers of glycemic control
T a b l e 1
Hemoglobin A1C
Among these markers, hemoglobin A1C (A1C) has been accepted as the fundamental biomarker and clinical surrogate endpoint in diabetes management and was used for the last three decades. It is well documented that in both type 1 and type 2 diabetes, A1C is predictive for the occurrence of diabetes complications many years later. However, deeper insight into the pathogenesis of diabetes has disclosed important limitations of A1C measurement. Early analyses recognized that upon comparing average glucose levels in patients with diabetes can result in different average glucose concentrations at a given A1C value. In a minority of patients such mismatch might partly be explained by unequal temporal distribution of glucose sampling, but more importantly, there are studies to provide evidence that this observation is due to changes in intracellular glycation rates [8]. Other known conditions that could interfere with A1C measurement, causing erroneous values, are high red cell turnover, anemia, blood transfusion, chronic renal or liver disease [9], and drug treatment. The most important limitation of A1C, as a marker of glycemic control over the previous 2–3 months, is its inability to capture shorter-term changes of glycemia. In well-controlled patients with type 2 diabetes, we have previously shown that A1C is mainly determined by chronic sustained hyperglycemia and glycemic fluctuations go undetected [10]. However, this is critical for safe and timely adjusted insulin administration and clinical decision making. Therefore, researchers tried to introduce additional markers for better characterizing glycemic control during shorter periods of time. These markers, however, have specific characteristics and are not equally suited for diabetes management.
Glycated albumin
In recent years, serum glycated proteins with shorter half-lives (17–20 days) than hemoglobin have been evaluated as markers of intermediate glycemia. The fructosamine assay is used to measures glycation of serum proteins, principally albumin [11]. Glycated albumin (GA) has been reported to be a useful marker of glycemic control in diabetes [12]. It is a more rapidly responding indicator than hemoglobin, although the glycation rate for both proteins is comparable [13]. Since glycated albumin was shown to be an independent variable of maximum glucose levels, it appears to be a more sensitive marker than A1C for glycemic excursion, as they occur during postprandial times [14]. This is important because postprandial glucose excursions are known risk factors for diabetic microand macrovascular complications. More recently, it was found that serum GA levels are higher in relation to A1C in diabetes patients with reduced basal pancreatic ß-cell function [15]. If in the state of postprandial hyperglycemia, indicating postprandial ß-cell dysfunction, serum GA were found to be increased, then it could be a useful surrogate marker for cardiovascular risk. This has not yet been confirmed by clinical trials, although the finding of elevated GA, but not A1C levels in patient with coronary artery stenosis points out such a relationship [16].
1,5-Anhydroglucitol
Another analyte, 1,5-anhydroglucitol (1,5-AG), has been suggested for use as intermediate marker of glycemia to complement A1C measurements [17]. It is a naturally occurring polyol that competes with glucose for tubular re-absorption and can thus not be used as a marker for glycemic control in patients with impaired kidney function. Furthermore, it should be noted that glucose levels exceeding the renal threshold for glycosuria, i.e. 10 mmol/L (180 mg/dL), lead to a rapid reduction in serum concentration of 1,5-AG [18]. Poor glycemic control, indicated by high A1C values, is therefore associated with lower instead of higher 1,5-AG levels. Although this marker responds sensitively and rapidly to daily glucose excursions in patients with near or at goal A1C levels [19], it can not identify hypoglycemia. Dungan et al. [20] have reported that 1,5-AG varied markedly in diabetes patients despite similar A1C and showed that this was mainly attributable to different postprandial glucose excursions. This makes 1,5-AG superior compared to A1C or GA (serum fructosamine) measurements as a marker for identifying postprandial hyperglycemia. Consequently, 1,5-AG has been used to evaluate drug strategies on postprandial glycemia. Studies, including exenatide [21], sitagliptin [22] or biphasic insulin [23], for example, support the usefulness of 1,5-AG as a marker to identify treatment effects on postprandial glycemic excursions that would have otherwise been missed.
Measures of glycemic variability
It is a well-known clinical observation that glucose profiles can greatly differ at similar or even identical A1C values. While some patients have small or moderate glucose excursions and rare hypoglycemia, others have marked postprandial increases with frequent hypoglycemic episodes. These ups and downs in glucose levels over time, either measured within 24 hours or from day to day at the same time point, reflect glycemic variability (GV) classified as within-day and between-day variability, respectively [24]. It remains controversial whether GV is an independent causative or contributing factor to diabetes complications. However, there are data demonstrating close associations between GV and carotid intima-media thickness [25] and microvascular complications [26]. The findings and observations that GV more than sustained chronic hyperglycemia induces increased oxidative stress [27] provide strong indications that GV is involved in the development of vascular disease. In clinical practice, minimizing GV is important to achieve acceptable glycemic control without hypoglycemia [28–30].
With the advent of CGM various indices of GV gained considerable clinical importance [31]. Currently, numerous indices are available, which have been carefully characterized by Rodbard [32] and Cameron et al. [33] for evaluation of various aspects of GV. Although they can principally be calculated from frequently sampled SMBG data, it is most suitable to use CGM datasets, because capturing all glucose peaks and nadirs requires sampling frequencies of 1–5 minutes. Furthermore, it is very important to clearly differentiate between indices of GV and indices of the quality of glycemic control. Measures of GV quantify short-term changes in glycemia and are suitable for different and specific aspects of glycemic control but should not be interchanged. Validated indices such as mean amplitude of glycemic excursions (MAGE), mean of daily difference (MODD), continuous overall net glycemic action (CONGA) are often used in clinical research, but they are not easy to calculate and computer programs have been developed for better handling of sampled glucose data. We have recently developed a computer program to calculate MAGE [34], and meanwhile, there is other software available, such as GlyCulator [35] and EasyGV [available at www.easygv.co.uk] for computing glycemic variability indices. Most recently, an expert panel of diabetes specialists recommended for the ease of use, familiarity, and correlation with other factors of glycemic control, the following three measures of GV: SD around the mean glucose (SD), coefficient of variation (CV), and interquartile range (IQR) [36]. Especially, if CGM data are collected, IQR is the most reliable aggregate measure of GV, as the panel announced.
In addition to evaluation of GV by the aforementioned metrics, various indices have been developed to estimate the quality of glycemic control to complement clinical assessment of diabetes treatment, such as the average daily risk ratio (ADDR), including the high (HBGI) and the low blood glucose index (LBGI) [37] and the glycemic risk assessment diabetes equation (GRADE) [38]. These metrics are calculated by converting glucose values into risk scores, i.e. they quantify the risk for glycemic extremes.
Mean glucose
Mean glucose is a metric that is equally understood by patients and clinicians. Although not crucial for therapeutic decisions, it is useful to indicate glucose exposure during specified time periods and could help determine effects of food, exercise or diabetes medications [39]. Especially when CGM data is being reviewed, an A1C level derived from mean or average glucose [40] provides an option for reporting glucose exposure during a defined time period. However, as reported by Kilpatrick et al. [41], the relationship between mean glucose and A1C may differ between different treatment groups. As demonstrated in Fig. 1, our results obtained from a cohort of type 2 diabetes patients (n = 114) treated with diet and oral antidiabetes drugs, further revealed that mean glucose derived from CGM measurements was more strongly correlated with time spent in hyper-/hypoglycemia than with A1C. Correlation coefficients for mean glucose vs. hyperand hypoglycemia were r = 0.965 and –0.345 (Fig. 1A) and for A1C r =0.508 and –0.226, respectively (Fig. 1B). Correlation coefficients of similar magnitude were reported by Nielsen et al. [42] for type 1 diabetes patients between A1C and fraction of time during hyper-/hypoglycemia, expressed as area under the CGM curve (AUC).
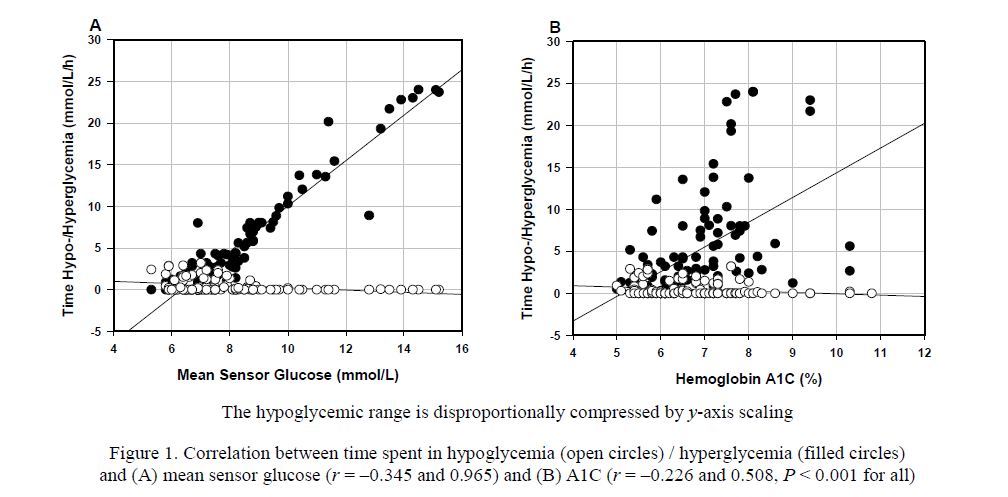
Figure 1. Correlation between time spent in hypoglycemia (open circles) / hyperglycemia (filled circles) and (A) mean sensor glucose (r = –0.345 and 0.965) and (B) A1C (r = –0.226 and 0.508, P < 0.001 for all)
As our previous data from the cohort of type 2 diabetes patients demonstrated, % CV is one of the GV metrics, which is closely correlated with the risk of hypoglycemia (r = 0.554, P <0.001). Even though significant, the correlation between A1C and hypoglycemia shown in Fig. 1B is weak. Multiple logistic regression analysis further revealed that the odds ratio for % CV was higher than for mean sensor glucose: 1.25; 95 % confidence interval (CI), 1.14–1.37 vs. 0.41; 95 % CI: 0.21–0.61 (P <0.001 for both), while A1C was not a significant predictor (unpublished data). Overall, this clearly shows that A1C provides no reflection of hypoglycemia exposure.
It has also been discussed whether postprandial glucose should become a marker of glycemic control. As suggested by Avogaro [43], postprandial glucose may rather represent a surrogate of metabolic events occurring in the postprandial phase. On the other hand, we found a close correlation between mean glucose and postprandial glucose in our cohort of type 2 diabetes patients (r = 0.630, P < 0.001). This indicates that changes in postprandial glucose levels are adequately reflected by mean glucose values.
Glucose monitoring
The development of hand-held blood glucose meters some decades ago made it possible for diabetes patients to monitor their own blood glucose levels at any time in a convenient way and enabled adjustment of therapy. With the universal availability of glucose meters, SMBG found broad application for management of glycemic control. However, this traditional monitoring usually measures single glucose values at any time point, which is determined by the user. Thus, it provides only a snapshot of the whole glucose picture and rapid changes occurring between single measurements escape detection. The development of the CGM technology presented a great step forward toward modern diabetes management, because it overcomes limitations of traditional SMBG by producing glucose profiles instead of distinct measurements over several days, real-time glucose values, glucose trends and warnings when glucose values approach dangerously low or high levels.
As demonstrated in Figure 2, CGM recordings also, provided evidence that diurnal glucose patterns may considerably differ in individual patients, even at identical A1C levels — a fact overlooked in the past.
The figure shows individual average CGM profiles from a subsample of type 2 diabetes patients with an A1C value of precisely 6.5 %. Although this is an acceptable A1C value and indicative of good metabolic control, the CGM profiles are quite different in that: (1) most of them exceed the target range and (2) they show marked glycemic excursions. It is conceivable that frequent use of CGM and careful pattern analysis is able to improve glycemic control by uncovering such trouble points.
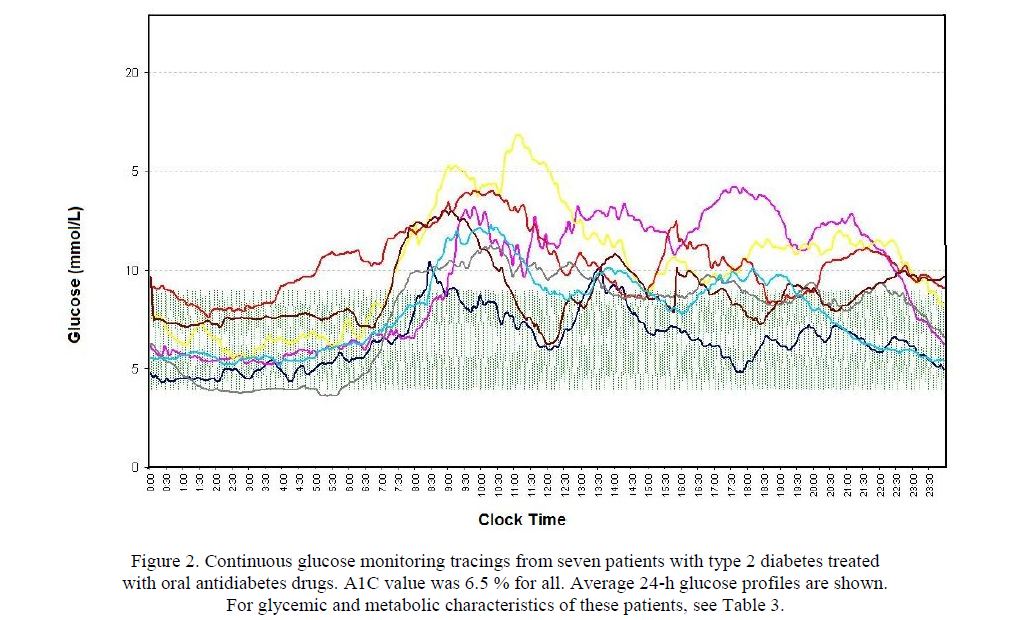
Figure 2. Continuous glucose monitoring tracings from seven patients with type 2 diabetes treated with oral antidiabetes drugs. A1C value was 6.5 % for all. Average 24-h glucose profiles are shown.
For glycemic and metabolic characteristics of these patients, see Table 3.
Clinical study outcomes and data obtained from every-day diabetes management have shown that the use of CGM can consistently improve glycemic control [44]. Although especially those with unstable diabetes who are prone to hypoglycemia and hypoglycemia unawareness will benefit most, the majority of diabetes patients can achieve their glucose targets when using CGM [45]. Two variants of CGM based on sensor technology are available: retrospective and real-time glucose monitoring [46–48]. While CGM systems such as CGMS Gold, Guardian T, Glucoday, and iPro2 were mainly designed as a tool for health care providers to collect glucose data over a sensing period of 3–7 days during which the data were masked to patients, provide real-time sensors (Guardian RT, Dexcom Seven Plus and Navigator) real-time glucose values, trends, and alarms if glucose levels become high or low. The latter systems enable immediate therapy adjustment and correction of glucose levels, but require training experience for both health care practitioners and patients. Even though use of CGM has convincingly demonstrated improvement of glycemic control, i.e. reduction of time spent in hypo-/hyperglycemia, reduced glucose variability, and improvement of A1C levels, this technology is still underutilized in diabetes management for a number of reasons [36]. All the commercially available CGM devices have similar but somewhat different software to analyze the data and provide reports. However, the main problem is the lack of standardized metrics and a more user-friendly presentation of data.
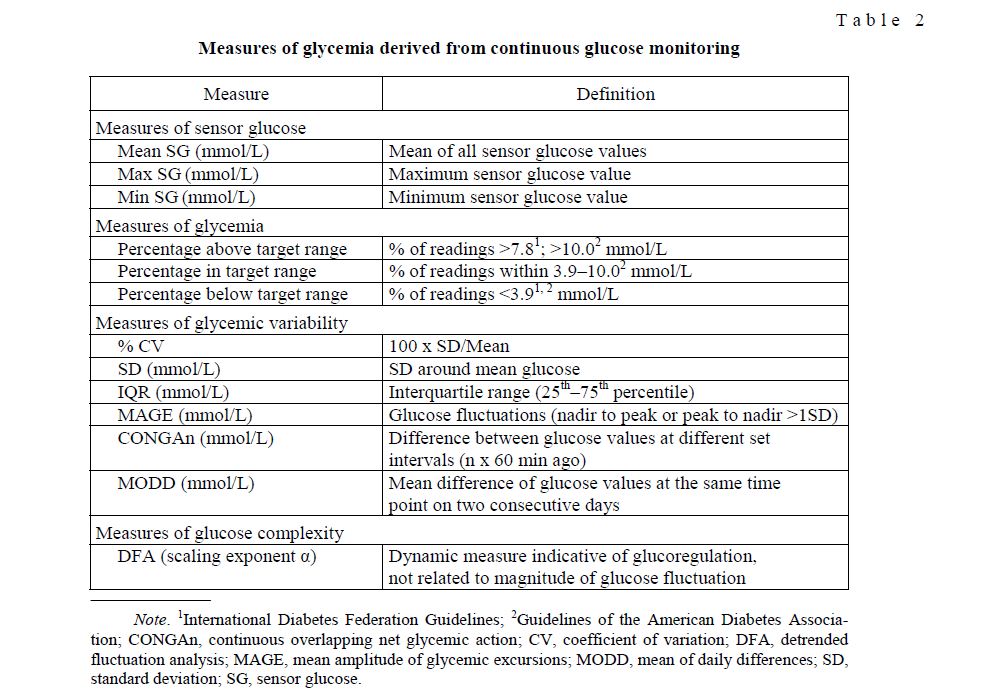
There are currently several well-established clinical and research measures that have shown to be useful in analyzing and characterizing CGM profiles.
Table 2 summarizes measures of glycemic control often used in clinic and research for which normative values are available. Of the metrics shown (Table 2), it should be noted that the aforementioned expert panel identified time in range (TIR) as one of the key metrics for guiding diabetes treatment [36]. This metric can be expressed either as «% of glucose readings» or «hours per day». As the default target range, 70–180 mg/dL (3.9–10.0 mmol/L) was selected. This is not a «normal» range, but commonly used in clinical practice. Individual targets closer to the ideal range can be defined, depending on age, comorbidities or patient compliance.
Measures of glycemia derived from continuous glucose monitoring
T a b l e 2
Standardized glucose reporting
One major barrier for broader application of CGM is certainly the existence of multiple indices and parameters for measurement of glycemic control and glycemic variability. Clinicians must interpret these parameters to extract the information they need to guide management of their diabetes patients. Some of the parameters, which we use for evaluation of glycemic control and guiding patients treatment are displayed in Table 3.
The data in Table 3 demonstrate how the magnitude of glycemic measures may individually differ even in rather well-controlled type 2 diabetes patients and compared to healthy subjects. In our random sample (n = 7) all patients were treated with oral antidiabetes drugs and, even though well-controlled, it should be noted that the maximum time spent in hypoglycemia was roughly 49 min/day. Among the parameters shown, the detrended fluctuation analysis (DFA) scaling exponent can not be used for adjustment of therapy or glycemic management but rather in clinical research for assessment of the impaired complexity of glucoregulation.
In view of the various metrics used to characterize glycemic variability and quality of glycemic control, an integrated approach is required. To ease analysis of CGM and SMBG data, Rodbard [52] has presented a practical approach to definition of reference values for measures of quality of glycemic control and measures of glycemic variability. He calculated quartiles (minimum, 25th, 50th, 75th percentiles and maximum) for six measures of glycemic variability as well as measures of glycemic control from a reference population. So, by using such a score sheet, one can utilize the areas above and below the curves for the percentiles in relation to A1C levels to define glycemic control as Excellent, Good, Fair, and Poor. We used a somewhat different approach to evaluate the quality of glycemic control from CGM profiles and developed a Quality score (Q-score) [53]. This score is a composite metric related to A1C, integrating mean glucose, time hypo-/hyperglycemic, range of glucose values, and MODD. After calculating the score, one can classify the quality of glycemic control into five categories; Excellent, Good, Fair, Poor, and Unsatisfactory.
Variations in the magnitude of characteristic glycemic and metabolic measures in well-controlled type 2 diabetes patients with A1C value of 6.5 % and normative values in patients without diabetes
T a b l e 3
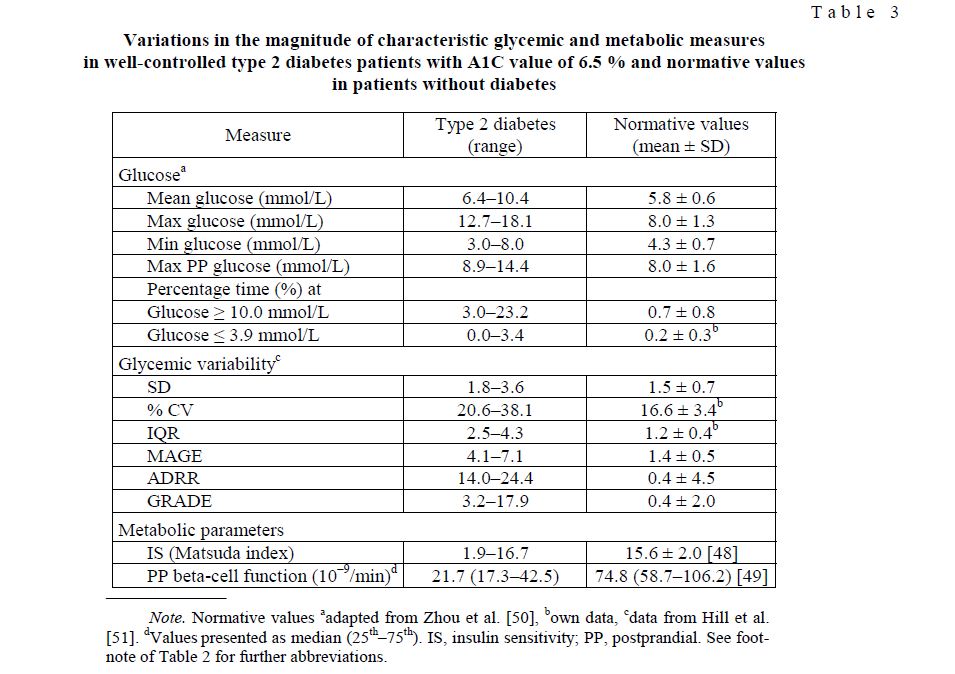
Note. Normative values aadapted from Zhou et al. [50], bown data, cdata from Hill et al. [51]. dValues presented as median (25th–75th). IS, insulin sensitivity; PP, postprandial. See footnote of Table 2 for further abbreviations.
With the goal to translate glycemic variability measures into the clinic, Rawlings et al. [54] created a user-friendly Continuous Glucose Monitoring User Interface for Diabetes Evaluation (CGM-GUIDE©). This interface calculates and displays multiple measures derived from CGM data. It allows for user-defined thresholds for hyperand hypoglycemia and calculates the glucose variability measures SD, MAGE, CONGAn, and MODD in conjunction with glycemic statistics, i.e. time spent in target range, time spent in hyper-/hypoglycemia, areas under the CGM curve (AUC-CGM), and mean glucose.
Only recently, the International Diabetes Center (Minneapolis, USA) has developed the data analysis software program (capture AGP™) called Ambulatory Glucose Profile AGP «Dashboard» and issued recommendations for standardizing glucose reporting and analysis to optimize clinical decision making [36].
Computer-assisted decision support systems for diabetes management
With the growing number of diabetes patients worldwide, the expanding classes of diabetes medications and variety of treatment modalities, it becomes more and more difficult for primary care providers to assess the quality of glycemic control and keep abreast with recent developments. As a consequence, the portion of patients not achieving their treatment goals remains irresponsibly high.
In type 1 diabetes, software to adjust insulin dosage and adopt treatment regimens was successfully introduced [55, 56], but to generate computer-assisted decision support programs for type 2 diabetes has been difficult, because of its complex pathophysiology. Only as of 2007, the Karlsburg Diabetes Management System (KADIS®), developed by a team of researchers at the Institute of Diabetes Karlsburg, Germany, became available as a computer-based decision support for management of type 2 diabetes, using input of CGM data for glycemic control and optimized diabetes therapy. A mathematical description of the KADIS® model can be found at [57] and more details will be given in a following article of this journal volume.
A randomized study performed in outpatients with type 2 diabetes over three months, utilizing KADIS®, demonstrated a net reduction in A1C of 0.6 % and curtailed time spent in hyperglycemia by 22 % without increasing hypoglycemia [58].
In 2011, Rodbard and Vigersky [59] developed a computer-assisted decision support (CADS) for primary care providers to improve diabetes management in type 2 diabetes patients. This system is based on the input of SMBG data, including clinical information (diagnosis, comorbidities, medication history, history of adverse events, and laboratory data), rules for dosing individual medications, adding or discontinuing medications; and rules for individualizing targets for A1C and glucose levels by time of day. Various outputs are provided, such as analysis and display of SMBG data, therapy recommendations, several therapy options; and educational information for care professionals and patients. CADS can interact with other systems to collect glucose meter data via the MetriLink device and with the comprehensive diabetes management program (CDMP). As the authors stated, the system is currently implemented in a clinical research setting and adaptation to other health care systems are being intended [59]. Even if the outputs of KADIS® and CADS are similar, the underlying algorithms appear to be different. KADIS® is able to generate a virtual copy of glucose metabolism and allows interactive simulation of various therapeutic regimens in optimizing glycemic control of individual patients.
Conclusions
During recent years, many new tools and metrics have been developed. The time has come to use CGM more widely in diabetes management and to introduce, in addition to A1C, metrics that allow assessment of continuous glucose sensing for better glycemic control on a day-to-day basis. An important step in this direction would be standardization of glucose metrics and glucose reporting.
Data analysis software (capture AGP™) as well as computer-assisted decision support systems (KADIS®, CADS) has the potential to optimize clinical decision making and diabetes management to the benefit of our patients.
References
- The Diabetes Control and Complication Trial Research Group. The effects of intensive treatment of diabetes on the development of and progression of long-term complications in insulin dependent diabetes mellitus// Engl. J. Med. ― 1995. ― Vol. 329, No. 14. ― P. 304–309.
- Turner C., Holman R.R. et al. Intensive blood glucose control with sulfonylureas or insulin compared with conventional treatment and risk of complications in patients with type 2 diabetes (UKPDS 33) // Lancet. ― 1998. ― Vol. 352, No. 9131. ― P. 837–853.
- Monnier , Lapinski H., Colette C. Contributions of fasting and postprandial glucose increments to the overall diurnal hyperglycemia of type 2 diabetic patients: variations with increasing levels of HbA1c // Diabetes Care. ― 2003. ― Vol. 26, No. 3. ― P. 881–885.
- Temelkova-Kurktschiev T.S., Koehler C. et al. Postchallenge plasma glucose and glycemic spikes are more strongly associated with atherosclerosis than fasting glucose or HbA1c level // Diabetes Care. ― 2000. ― Vol. 23, No. 12. ― P. 1830–1834.
- Raz , Wilson P.W. et al. Effects of prandial versus fasting glycemia on cardiovascular outcomes in type 2 diabetes: the HEART2D trial // Diabetes Care. ― 2009. ― Vol. 32, No. 3. ― P. 381–386.
- Action to Control Cardiovascular Risk in Diabetes Study Group, Gerstein C., Miller M.E. et al. Effects of intensive glucose lowering in type 2 diabetes // N. Engl. J. Med. ― 2008. ― Vol. 358, No. 24. ― P. 2545–2559.
- ADVANCE Collaborative Group, Patel A., MacMahon S. et al. Intensive blood glucose control and vascular outcomes in patients with type 2 diabetes // N. Engl. J. Med. ― 2008. ― Vol. 358, No. 24. ― P. 2560–2559.
- Cohen R.M. A1C: does it fit all? // Diabetes Care. ― 2007. ― Vol. 30, No. 10. ― P. 2756–2758.
- Goldstein D.E., Little R.R. et al. American Diabetes Association Technical Review on Tests of Glycemia // Diabetes Care. ― Vol. 18, No. 6. ― P. 896–909.
- Kohnert D., Augstein P. et al. Chronic hyperglycemia but not glycemic variability determines HbA1c levels in wellcontrolled patients with type 2 diabetes // Diabetes Res. Clin. Pract. ― 2007. ― Vol. 77, No. 3. ― P. 420–426.
- Mittman N., Desiraju B. et al. Serum fructosamine versus glycosylated hemoglobin as an index of glycemic control, hospitalization, and infection in diabetic hemodialysis patients // Kidney ― 2010. ― Vol. 78, No. 117 (Suppl.). ― P. S41– S45.
- Yoshiuchi , Matsuhisa M. et al. Glycated albumin is a better indicator for glucose excursion than glycated hemoglobin in type 1 and type 2 diabetes // Endocr. J. ― 2008. ― Vol. 55, No. 3. ― P. 503–507.
- Cohen P., Hud E., Shea E. Rate of Formation of Glycated Albumin Revisited and Clinical Implications // J. Diabetes Metab. ― 2010. ― Vol. 1, No. 102. ― doi:10.4172/2155-6156.1000102.
- Takahashi , Uchino H. et al. Comparison of glycated albumin (GA) and gycated hemoglobin (HbA1c) in type 2 diabetic patients: usefulness of GA for evaluation of short-term changes in glycemic control // Endocr. J. ― 2007. ― Vol. 54, No. 1. ― P. 139–144.
- Koga M., Murai J. et al. Glycated albumin and glycated hemoglobin are influenced differently by endogneous insulin secretion in patients with type 2 diabetes // Diabetes Care. ― 2010. ― Vol. 33, No. 2. ― P. 270–272.
- Pu J., Lu L. et al. Increased serum glycated albumin level is associated with the presence and severity of coronary artery disease in type 2 diabetic patients // Circ. J. ― 2007. ― Vol. 71, No. 7. ― P. 1067–1073.
- Dungan K.M. 1,5-anhydroglucitol (GlycoMark™) as a marker of short-term glycemic control and glycemic excursions // Expert Rev. Mol. Diagn. ― 2008. ― Vol. 8, No. 1. ― P. 9–19.
- Akanuma , Morita M. et al. Urinary excretion of 1,5 anhydro-D-glucitol accompanying glucose excretion in diabetic patients // Diabetologia. ― 1988. ― Vol. 31, No. 11. ― P. 831–835.
- Kishimoto , Yamasaki Y. et al. 1,5-anhydro-d-glucitol evaluated daily glycemic excursions in well-controlled NIDDM // Diabetes Care. ― 1995. ― Vol. 18, No. 8. ― P. 1156–1159.
- Dungan K.M., Buse J.B. et al. 1,5-Anhydroglucitol and postprandial hyperglycemia as measured by continuous glucose monitoring system in moderately controlled patients with diabetes // Diabetes ― 2006. ― Vol. 29, No. 6. ― P. 1214–1219.
- Kazda , Bachmann O. et al. Exenatide verbessert bei Patienten mit Typ-2-Diabetes die postprandiale Glucosekontrolle, gemessen an der Konzentration von 1,5-Anhydroglucitol // Diabetologie und Stoffwechsel. ― 2008. ― Vol. 3. ― A221 ― doi: 10.1055/s-2008-1076368.
- Kishimoto M., Noda M. A pilot study of the efficacy of miglitol and sitagliptin for type 2 diabetes with a continuous glucose monitoring system and incretin markers // Diabetol. ― 2011. ― Vol. 10, No. 115. ― doi: 10.1186/1475-2840-10-115.
- Moses C., Raskin P., Khutoryansk N. Does serum 1,5-anhydroglucitol establish a relationship between improvements in HbA1c and postprandial glucose excursions? Supportive evidence utilizing the differential effects between biphasic insulin aspart 30 and insulin glargine // Diabetic Med. ― 2008. ― Vol. 25, No. 2. ― P. 200–205.
- Tylee T.S., Trence D.L. Glycemic variability: looking beyond the A1C // Diabetes Spectrum. ― 2012. ― Vol. 25, No. 3. ―149–153.
- Chen X.M., Zhang Y. et al. Correlation between glucose fluctuations and carotid intima-media thickness in type 2 diabetes // Diabetes Res. Clin. Pract. ― 2010. — Vol. 90, No. 1. ― P. 95–99.
- Monnier L., Colette C. et al. The effect of glucose variability on the risk of microvascular complications in type 1 diabetes // Diabetes Care. ― 2007. — Vol. 30, No. 1. ― P. 185–186.
- Monnier , Mas E. et al. Activation of oxidative stress by acute glucose fluctuations compared with sustained chronic hyperglycemia in patients with type 2 diabetes // JAMA. ― 2006. — Vol. 295, No. 14. ― P. 1681–1687.
- Monnier L., Wojtusciszyn A. et al. The contribution of glucose variability to asmptomatic hypoglycemia in persons with type 2 diabetes// Diabetes Technol Ther.―2007.—Vol. 13. No. 8.―P. 813–818.
- Qu Y., Jacober S. et al. Rate of hypoglycemia in insulin-treated patients with type 2 diabetes can be predicted from glycemic variability data // Diabetes Technol. Ther. ― 2012. — Vol. 14, No. 11. ― P. 1008–1012.
- Kohnert D., Heinke P. et al. Reduced glucose variability is associated with improved quality of glycemic control in patients with type 2 diabetes: a 12-month observational study // J. Endocrinol. Metab. ― 2011. — Vol. 1, No. 2. ― P. 64–72.
- Kohnert K.D., Vogt L., Salzsieder E.Advances in understanding glucose variability and the role of continuous glucose monitoring// European Endocrinol.―2010―Vol. 6. No. 1.―P. 53–56.
- Rodbard D. Interpretation of continuous glucose monitoring data: glycemic variability and quality of glycemic control // Diabetes Technol. Ther. ― 2009. — Vol. 11, No. Suppl. 1. — P. S55–S65.
- Cameron F.J., Donath S.M., Baghurst P.A. Measuring glycemic variation // Current Diabetes Rev. ― 2010. — Vol. 6, No. ― P. 17–26.
- Fritzsche , Kohnert K.D. et al. The use of a computer program to calculate the mean amplitude of glycemic excursions // Diabetes Technol. Ther. ― 2011. — Vol. 13, No. 3. ― P. 319–325.
- Czerwoniuk D., Fendler W. et al. GlyCulator: a glycemic variability calculation tool for continuous glucose monitoring data // J. Diabetes Sci. Technol. ― 2011. — Vol. 5, No. 2. ― P. 447–451.
- Bergenstal R.M., Ahmann A.J. et al. Recommendations for standardizing glucose reporting and analysis to optimize clinical decision making in diabetes: the ambulatory glucose profile (AGP) // Diabetes Ther. ― 2013. — Vol. 15, No. 3. ― P. 1– 14.
- Kovatchev B.P., Cox D.J. et al. Assessment of risk for severe hypoglycemia among adults with IDDM: validation of the low blood glucose index // Diabetes Care. ― 1998. — Vol. 21, No. 11. ― P. 1870–1875.
- Hill N.R., Hindmarsh P.C. et al. A method for assessing quality of control from glucose profiles // Diabet Med. ― 2007. — Vol. 24, No. 7. ― P. 753–758.
- Peterson , Chlup R. et al. Influence of oral antidiabetic drugs on hyperglycemic response to foods in persons with type 2 diabetes mellitus as assessed by continuous glucose monitoring system: a pilot study // J. Diabetes Sci. Technol. ― 2010. — Vol. 4, No. 4. ― P. 983–992.
- Nathan D.M., Kuenen J. et al. For the A1C-Derived Average Glucose (ADAG) Study Group: translating the A1C assay into estimated average glucose values // Diabetes Care. ― 2008. — Vol. 8, No. 11. ― P. 1473–1478.
- Kilpatrick E.S., Rigby A.S., Atkin S.L. Variability in the relationship between mean plasma glucose and HbA1c: implications for the assessment of glycemic control // Clinical Chemistry. ― 2007. — Vol. 53, No. 5. ― P. 897–901.
- Nielsen J.K., Gravolt C.H. et al. Continuous subcutaneous glucose monitoring shows a close correlation between mean glucose and time spent in hyperglycemia and hemoglobin A1c // Diabetes Sci. Technol. ― 2007. ― Vol. 1, No. 6. ― P. 857–863.
- Avogaro A. Postprandial glucose: marker or risk factor? // Diabetes Care. ― 2011. — Vol. 34, No. 10. ― P. 2333–2335.
- Buckinham B. Clinical overview of continuous glucose monitoring // J. Diabetes Sci. Technol. ― 2008. ― Vol. 2, No. 2. ―551–565.
- Juvenile Diabetes Research Foundation Continuous Glucose Monitoring Study The effect of continuous glucose monitoring in well-controlled type 1 diabetes // Diabetes Care. ― 2009. — Vol. 32, No. 8. ― P. 1378–1383.
- Blevins Professional continuous glucose monitoring in clinical practice 2010 // J. Diabetes Sci. Technol. ― 2010. ― Vol. 4, No. 2. ― P. 440–456.
- Mastrototaro , Welsh J.B., Lee S. Practical considerations in the use of real-time continuous glucose monitoring alerts // Diabetes Sci. Technol. ― 2010. ― Vol. 4, No. 3. ― P. 733–739.
- Maki C., Kelley K.M. et al. Validation of insulin sensitivity and secretion indices derived from the liquid meal tolerance test // Diabetes Technol. Ther. ― 2011. — Vol. 13, No. 6. ― P. 661–666.
- Hovorka R., Albarrak A. et al. Relationship between ß-cell responsiveness and fasting plasma glucose in Caucasian subjects with newly presenting type 2 diabetes // Diabet Med. — 2001. — Vol. 18, No. 10. ― P. 797–802.
- Zhou , Li H. et al. Reference values for continuous glucose monitoring in Chinese subjects // Diabetes Care. ― 2009. — Vol. 32, No. 7. ― P. 1188–1193.
- Hill N.R., Oliver N.S. et al. Normal reference range for mean tissue glucose and glycemic variability derived from continuous glucose monitoring for subjects without diabetes in different ethnic groups // Diabetes Technol. Ther. ― 2011. — Vol. 13, No. 9. ― P. 921–928.
- Rodbard Clinical interpretation of indices of quality of glycemic control and glycemic variability // Postgrad. Med. ― Vol. 123, No. 4. ― P. 107–118.
- Salzsieder , Vogt L. et al. Q-score: a new tool for objective assessment and verification of the quality of continuously measured glucose profiles // Diabetologie und Stoffwechsel. ― 2011. ― Vol. 6. ― P. 223.
- Rawlings R., Shi H. et al. Translating glucose variability metrics into the clinic via continuous glucose monitoring: a graphical user interface for diabetes evaluation (CGM-GUIDE©) // Diabetes Ther. ― 2011. — Vol. 13, No. 12. ― P. 1241–1248.
- Rutscher A., Salzsieder et al. KADIS — a computer-aided decision support system for improving the management of type-I diabetes // Exp. Clin. Endocrinol. ― 1990. — Vol. 95, No. 1. ― P. 137–147.
- Albisser A.M., Sakkal S., Wright C. Home blood glucose prediction: validation, safety, and efficacy testing in clinical diabetes // Diabetes Technol. Ther. ― 2005. — Vol. 7, No. 3. ― P. 487–496.
- Salzsieder , Vogt L. et al. Model-based decision support in diabetes care // Comput. Methods Prog. Biomed. ― 2011. ―Vol. 102, No. 2. ― P. 206–218.
- Augstein P., Vogt L. et al. Outpatient assessment of Karlsburg Diabetes Management System-based decision support // Diabetes Care. ― 2007. — Vol. 30, No. 7. ― P. 1704–1708.
- Rodbard , Vigersky R.A. Design of a decision support system to help clinicians manage glycemia in patients with type 2 diabetes mellitus // J. Diabetes Sci. Technol. ― 2011. ― Vol. 5, No. 2. ― P. 402–411.