Purpose – This paper is about business strategy concept considers academic literature from business strategy, management and organization research appeal to:
- Way of adjusting to the competitive conditions in period of unsteady economic environment;
- Reasons of selecting adjusting strategy;
- Way of adjustment influence on current and long-term financial
Methodology – Paper determines analysis used in research, its concepts and defined reasons they have been selected such as correlation analysis. It also defines the variables that should be measured and controlled.
Originality/value – Only few researches are particular directed on financial performance under recession situations. This study involved in organizational reaction to instability of environment such as market changes, over competition, slowdown of global economic growth.
Findings – Adjusting to modification environment is a required state of surviving of company in both unsteady and positive conditions; deny of adjustment causes drop of performance and organizational death. Non recession resources could be useful as well. As the research observes companies’ performance indicators that are connected and performed it are selected. Also paper presents the outcome of analysis and the ways it could be developed further.
Implementation innovations could not only have negative ideas increase in expenses but it also impacts significantly on profit improvement. It has been distinguished that employing innovations Kazakhstani companies increased efficiency of earning gross profit, net income and profit per sale and among that decreased the interest payments.
1 General concept of business strategy
Organizational strategy primary answers to two distinct aspects: type of organizational business and type of competition. Generally, organizations get strategic position estimation by:
- Examining situation of possible chances or dangers;
- Developing their strategic abilities;
- Measuring its opportunities and limitations.
Organizations vary on way of implementing those actions. In corporations’ analysis, selection and realization activates are conducted by several responsible people, meanwhile in small enterprises this could lay under responsibility of one employee [1].
Two popular schools of strategies could be determined in current literature: “positioning” and “resourcebased view” (RBV) schools. Determined by Porter positioning school consider organization as engaged in reaching “strategic fit” including conditions; meaning developing competitive advantages corresponding with environment in order to estimate conditions of implementing. In developed by Penrose (1959) and later Rumelt (1984) Wernerfelt (1984), and Barney (1991) RBV school organizational competitive force are orientated on capacities and ways of efficient using in order to reach competitive force. The latest studies has widened RBV by concept of “dynamic capabilities” in order to evaluate and widen capacities and expertise and adjust it to unstable conditions. In rapidly modifying conditions, current recession for instance, the concept of dynamic resources could be useful in evaluating structure for comprehending success and failure of some organizations. So there are two perspectives of examining organization, strategic fit and stretch, or external or inner perspective. Both of them are significant in researching process of adjustment to unstable situation.
1.1 Strategic Adaptation to Environmental Jolts, Turbulence and Radical Institutional Change
Adapting to environmental shocks is a capability all businesses have to develop in order to survive. Environmental shocks, or jolts, reshape the opportunities and threats the firm faces and are likely to render existing business strategies ineffective (Meyer et al.1990). Different types of environmental shock can occur with which businesses have to cope; such shocks change the level of environmental munificence, the level of resources available in a particular environment. Recession, an environment of falling GDP, is one type of shock. Much strategy literature is concerned with strategic change in circumstances of environmental jolts, turbulence, radical institutional change, industry deregulation or hyper competition. Although this literature does not always relate specifically to recession, certain themes may be relevant. Grewal and Tansuhaj (2001), for instance, show that strategic flexibility, the ability to respond quickly to changing competitive conditions (Hitt,et al.,1998) has a positive influence on business performance after a crisis. Others suggest that discontinuous change within an industry stimulates the formation of inter organizational relationships, promotes experimentation with new organizational forms and precipitates affiliations spanning industry boundaries (Meyer,1982).Inter -organisational networks absorb uncertainty arising from revolutionary change. Dixonet al. (forthcoming) discuss the dynamic capabilities required to survive and succeed in a transition economy namely, the interactions between exploitation learning(learning to do things better) and deployment capabilities within the organization, and the interactions between exploration learning (creation, experimentation)and the search and selection capabilities required to manage innovation routines. The concept of the ‘ambidextrous organization’ (He and Wong, 2004; Raisch and Birkinshaw, 2008; Tushman and O'Reilly, 1996) may be of relevance here.
1.2. Strategic Adaptation to Recession
Strategic change is often a complex process, involving planning by business owners and senior managers, and entailing long – term consequences for business performance. Inhyper–competitive or crisis situations, however, short term considerations might be dominant. Business restructuring in the form of replacement of managerial elites, functional reorganizations, and other changes to internal arrangements are often a precursor to, or a consequence of, strategic adaptation to recession (Whittington 1991; Geroski and Gregg 1994).
Recessions present businesses with a dilemma (Chastain 1982;Deanset al. 2009). On the one hand, firms experience pressures to cut costs in order to maintain survival in the short–run at the risk of reducing capacity to such a degree that the firm is unable to adapt adequately when recovery comes. On the other, businesses might also face pressures to maintain greater capacity, and thereby incur higher costs in the short–run, in order to retain the capability to adapt when the upswing comes and realize opportunities for long-term value creation. Silberston (1982) distinguishes the ‘statically efficient’ firm, one making the most efficient use of resources in given circumstances, with the ‘dynamically efficient’ firm, one capable of surviving changing circumstances. Clearly, businesses must be able to be both statically and dynamically efficient if they are to endure. Firms must be able to cut their cloth to survive present conditions while at the same time continue to invest in business development if they are to sustain satisfactory performance beyond the recession. So how, then, do businesses adapt under recession conditions?
There area number of approaches to explaining how firms adapt under recession conditions. One view argues that incumbent firms suffer from organizational inertia, which prevents them from adapting to new, hostile environmental conditions. Alternatively, the ‘pit – stop’ theory of business behavior suggests that in recession firms are more willing to innovate because the opportunity costs of not undertaking such action are lower than during more buoyant times (Geroski and Gregg 1997). Failure might induce unsuccessful firms to search for alternative ways of doing things (Cyert and March 1963). Businesses are more likely to have slack capacity during periods of falling sales, as resource stocks exceed current use. Under such circumstances, businesses might bring forward investment and innovation plans to take up the resource surplus and because incentives to continue business as usual are reduced. On the other hand, success also creates organizational slack, generating additional resources for innovation (Bourgeois III, 1981).
For simplicity, three types of business strategy are distinguished: retrenchment, investment, and ‘ambidextrous’ strategies. It is worth noting that studies tend to suffer from survivor bias, that is, they report the perceptions and actions of surviving firms; it is unclear whether, and how, these differ from non – surviving firms. The three strategy types are discussed below.
1.2.1. Retrenchment Strategies
Reducing strategies include lowering operational expenses and deprivation of noncore assets. During crisis period organizational outlook normally are decreased by owners or managers and move attention on current survival rather on long-run goals. Considers that it is more comfortable to decrease expenses than producing extra profit many organizations select retrench. Representatives inform aboutdeprivation of organizations, bankruptcy, decreasing working hours, employment expenses on activities such as research and Development (R&D), marketing and personnel training [2, p. 3–11]; [3, p. 31, 3, 62–72]; [4, p. 3, 35–45]; [5, p. 3, 46–61]; [6].
Research of Geroski and Gregg’s of 600 primary big corporations in period of early 1990s crisis discovered that mostly was implemented refocusing organization mostly due to managing expenses by dismissing employees and closing departments or institutions. Broadening or diminishing range of goods was less used. Researchers discussed possible existence of stimulus to reduce expenses during crisis as opposition of cyclical rises, where s less such stimulus due to increasing profit. Inclosure in assets decreased but not in intangibles like training, R&D and marketing. The research proofs data for the “pit-stop” theory of organizational behavior in period of crisis except several organizations, which increased investment activity due to capacities.
Holdings with scatter organizational structure and unusual fast growing companies were mostly affected by crisis in mid-late 1980. Amusing that organizational performance indicators were contrasting in different economic cycles. Pre-crisis profit indicator couldn’t be considered without within-crisis and post-crisis profit performance [6], as a proof of existing market pressure factor in line with pre-crisis profit performance. Earlier profitable organizations might have specific cost or demand shock in period of crisis that cause decrease profit performance. Contrary, earlier poor performance might adjust to crisis the way that wouldn’t let it increase.
Novation process is normally cut in period of crisis. Geroski and Walters discovered that novation process changes during business cycle, followed by decreasing number of awarded innovations and patents in period of crisis. Organizations continued significant but less covered organizational restructure, which started and was conducted in big amount of cases in pre-crisis period. Expenses on R&D In developed economic were reduced in period of crisis in 1990-95s. In such conditions it could be predicted the emphasis more on cost, than on quality affected by innovation, so used decline cost on premium quality [7]. For instance, cheap airlines appeared in early 90s crisis. Decreasing expenses, frowning investment, decreasing taken market segment trends were discovered in many UK companies' respond on 2000-2001 crisis. Researchers discussed if it was by accident.
Organizations which practiced new business models, fulfilled strategically ides and discovered new markets presented best performance results in period of early 1990s crisis.
Harrigan (1980) studied “endgame strategies” in several US industries in period of crisis in late 1970s. the research concentrate on way of managing with external conditions where future demand assume to be lower than existing demand, so changing the value of organizational assets decrease. Harrgan recognized a range of strategies differ in terms of market share level and the degree of reinvestment demanded continuous strategic position. Strategies involve:
- Raise of investments in order to achieve leading positions;
- Support investment level in order to proceed latest used tactics;
- Discriminatory decrease to respond on market by prioritizing investment;
- Milking investment in order to collect value of previous investment without long term positioning;
- Immediate divestment to return assets value.
Endgame strategies were associated with various market characteristics, industry structural traits, the needs of the firm exogenous to the endgame industry, and the firm’s internal strengths relative to industry rivals. Business survival and success relate to matching strategy to the ‘endgame environment’. Pressures on price, capacity and margins vary across declining industries, as do the customer base, technology, marketing and competitive response. There may be some overlaps between firms’ strategies during recession and endgame strategies in declining industries but, perhaps, this should not be pushed too far unless recession pushes an industry into an endgame environment. Otherwise, firms are likely to perceive the recession as a temporary interruption to a pre–existing demand trend line and behave with a view to exploiting opportunities once recession passes. Business strategies would then likely reflect an understanding of the longer ‐ term opportunities likely to become available rather than necessarily presupposing demand to be on a terminally downward trajectory.
Concluding, retrenchment strategy seems to be the most used short-run approach by organizations in period of crisis. Positive outcome of crisis is occurring motivation for examining their activity and concentrate on primary sights, improving performance by reducing operating expenses and non-profitable assets. Negative side is defining expenses and assets as reaction on disadvantageous market conditions and weakening abilities of reaction. Susceptibility on diverse outcome of crisis, reactions on it and not enough researches defining ways of retrench selection, conditions allowing or restricting retrenchment or relation between retrenchment and organizational performance.
2 Methodology
- Theoretical model of research
It would be explained how model is processing.
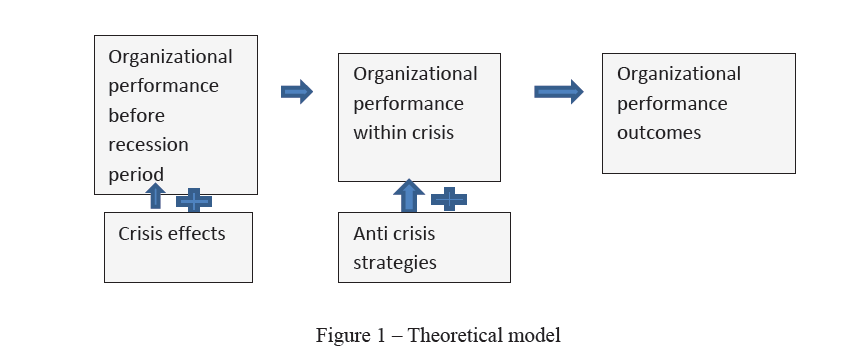
Figure 1 – Theoretical model
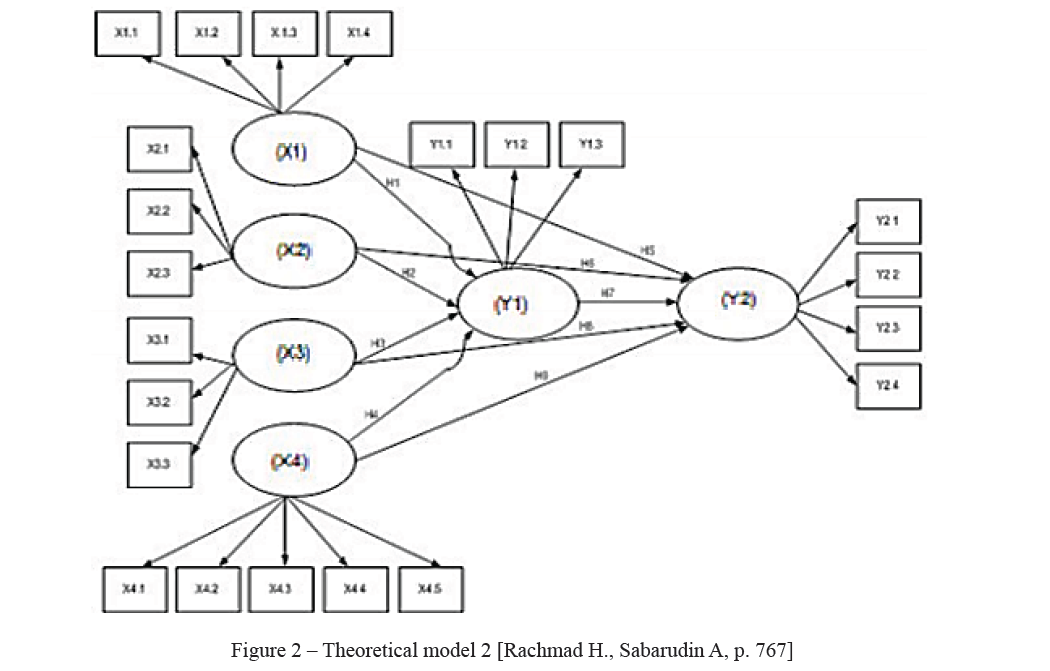
Figure 2 – Theoretical model 2 [Rachmad H., Sabarudin A, p. 767]
According this procedure would be developed research process and data collection aspects.
Concluding foregone pre-, within-crisis and after implementing strategies performance should be examined. Further, various variables need to be researched. They will be considered onwards.
2.2 Methodology classification
Cross-sectional study is valid for evaluating the effect of strategy implementation on organizational performance. By conducting such research it could be seen connection between distinct variables in course of time.
First, hypotheses, which distinguish connection between two variables, should be defined. This analysis also covers crisis effect, and strategy implementation on organizational performance and character of its relationship.
2.3 Specification of work
Following the defining model and concept of its analysis, problem areas and lacks in disclosing RQs need to be defined. By and large it is believed anti crisis strategy implementation has an effective influence on organizational performance, but external factors have to be considered as well. This derives further progresses. First of all, variables need to be measured in some period of time with defining requirements and sample selection methods. All collection data should be described and during analysis hypotheses should be accepted or rejected, so criteria of acceptance or rejection should be highlighted. For defining accurate inference relevance of outcomes should be considered.
2.3.1Variables
First of all, should be collected and considered numerous variables. The basic dependent variable of this research is organizational performance, which is strongly hangs on strategy implementation. In addition, various control variables are enabled.
Dependent variable: organizational performance: first of all, definition of performance is needed to be determined. Referring the business dictionary, performance is “the accomplishment of a given task measured against preset known standards of accuracy, completeness, costs, and speed”. Although performance measurement is broad definition and includes various spheres, this study considers financial performance indicators due to diversity of researched companies’ directions. In complete, the research considers liquidity, efficiency and financial leverage as performance indicators. [2]
This variable supposed to be effected by independent variable as crisis effects and strategy implementation.
Implemented strategy indicators: monitoring the effect of implemented strategy other factors should be considered, such as efficiency and leverage
2.3.2 Measurement period
In order to limit research time lime should be defined. The first wave of crisis in this study is defined by 2014, when Kazakhstani currency first was devaluated against USD. So in positive perspective data should be collected starting with that period, however it could be difficult, because of lifetime existing of companies or other problems.
For deriving accurate conclusion information should be collected before the strategy implementation period and crisis period in order to highlight difference of performance indicators. Changes of performance could be not related to strategy implementation and be explained by other factors. So in positive prediction, research should cover 2014 – 2017 years period.
2.3.3 Sampling and data collection
Next step is sampling. Focus of this research is on companies’ performance during recession, so companies which conducted its activity in period of crisis could be considered.
After describing variables and restricting research period data collection could be conducted. Research considers various indicators, which should be included into surveys. The problem could occur on collecting information from annual reports. Based on collected data, hypotheses are needed to be tested using correlation, regression and other analysis.
2.4 Analysis methodology
Relations between those variables could be discovered by correlation and regression analysis. Concluding, before outcome research questions appropriateness should be examined.
Descriptive statistics:in order to observe standard and average deviations decretive analysis would be considered. It should be divided by periods.
Correlation: first of all it is needed to distinguished connection between strategy realization and organizational performance by employing Pearson’s correlation coefficient. Correlation evaluates the level of dependence between variables, which in this research are strategy implementation and organizational performance. Though correlation doesn’t give explanation on causality and type of relation there should be employed other types of analysis.
3. Analysis
- Descriptive statistics
Sampling of data collection was random and definition of organizational performance in this research consists of several different variables is a reason for implementing descriptive statistics before analyzing data. First of all, SPSS provides descriptive statistics for all variables of research. Standard deviation should be high for explaining some variety in data. Whether the deviation is low, it presents insignificance in observation. On this basis it is concluded that variable needs to be removed.
Descriptive statistics gives general information of sample. It includes the mean and standard deviation of all of the variables. Considering mean, it presents the central tendency. Considering results almost all of them are concentrated in left part. Standard deviation presents spread of data. As less it is spread as more specific results are. Normally, standard deviation is spread within 3 standard deviations on each side. Skewness presents way of distribution. If skewness is positive, data skewed right, which means that its right tail is longer and reciprocally inversely. Analyzing kurtosis shows the infrequent extreme deviations.
Table 1 – ROE descriptive statistics
Statistics
|
|
ROE 2013 |
ROE 2014 |
ROE 2015 |
ROE 2016 |
|
|
N |
Valid |
30 |
30 |
31 |
31 |
|
Missing |
1 |
1 |
0 |
0 |
|
|
Std. Deviation |
1,7289148 |
7,2076774 |
5,4371185 |
1,1811912 |
|
|
Skewness |
5,207 |
5,455 |
5,317 |
4,225 |
|
|
Std. Error of Skewness |
,427 |
,427 |
,421 |
,421 |
|
|
Kurtosis |
27,977 |
29,827 |
29,080 |
22,508 |
|
|
Std. Error of Kurtosis |
,833 |
,833 |
,821 |
,821 |
|
As it could be observed, ROE changes during period. One data is missing because of its meaning is equal to 0. Recovery is not expected as its standard deviation is declining during crisis period. Standard deviation of ROE of 2014 is larger than 3, which means it is spread widely. Supposedly it means that organization reacted differently on first crisis wave. Test statistics could show how data is skewed. It could be calculated as skewness divided on its standard deviation. ROE in this research are higher than 2, which means it positively skewed and less error probability. Kurtosis is larger than 3, which means sample has a normal distribution. And its statistic test is higher than 2, it means that it largely excesses.
Table 2 – ROA descriptive statistics
|
|
ROA 2013 |
ROA 2014 |
ROA 2015 |
ROA 2016 |
|
|
|
1 |
2 |
3 |
4 |
5 |
|
N |
Valid |
31 |
31 |
31 |
31 |
|
Missing |
0 |
0 |
0 |
0 |
|
|
Std. Deviation |
,6207709 |
,1515477 |
,1559473 |
,6545930 |
|
|
Skewness |
5,402 |
-2,689 |
-,567 |
-5,179 |
|
|
Std. Error of Skewness |
,421 |
,421 |
,421 |
,421 |
|
|
Kurtosis |
29,757 |
11,961 |
2,869 |
28,298 |
|
|
Std. Error of Kurtosis |
,821 |
,821 |
,821 |
,821 |
|
As it could be observed, ROA changes during period. Effectiveness was declining during crisis period but recovery is expected. Standard deviation of ROE of 2014 is less than 3, which means it isn’t spread widely. Skewness is changing and getting less than 0, which means there couldn’t be defined any conclusion. Test statistics could show how data is skewed. It could be calculated as skewness divided on its standard deviation. ROE in this research are less than 0, which means it couldn’t be any conclusion. Kurtosis is higher than 3, which means sample has a normal distribution. And its statistic test is higher than 2, it means that it largely excesses.
Table 3 – Financial leverage descriptive statistics
|
|
financial levarage 2013 |
financial levarage 2014 |
financial levarage 2015 |
financial levarage 2016 |
|
|
|
1 |
2 |
3 |
4 |
5 |
|
N |
Valid |
30 |
30 |
31 |
31 |
|
Missing |
1 |
1 |
0 |
0 |
|
|
Std. Deviation |
13,4508549 |
34,9308139 |
14,2598553 |
4,5182934 |
|
|
Skewness |
-5,115 |
5,216 |
-4,608 |
,556 |
|
|
Std. Error of Skewness |
,427 |
,427 |
,421 |
,421 |
|
|
Kurtosis |
27,296 |
27,859 |
24,103 |
2,767 |
|
|
Std. Error of Kurtosis |
,833 |
,833 |
,821 |
,821 |
|
As it could be observed, financial leverage changes during period. Sensitivity of debt changes for was changing during crisis period but recovery was expected. Standard deviation of financial leverage is less than 3, which means it is spread widely. Skewness is changing and getting less than 0, which means there couldn’t be defined any conclusion. Test statistics could show how data is skewed. It could be calculated as skewness divided on its standard deviation. Financial leverage in this research is changing, which means it couldn’t be any conclusion. Kurtosis is higher than 3, which means sample has shorter and thinner tails and its peak is lower and broader during beginning crisis period, but last year it has normal distribution. And its statistic test is higher than 2, it means that it largely excesses.
Table 4 – ROS descriptive statistics
|
|
ROS 2013 |
ROS 2015 |
ROS 2014 |
ROS 2016 |
||
|
|
1 |
2 |
3 |
4 |
5 |
|
|
N |
Valid |
31 |
30 |
31 |
31 |
|
|
Missing |
0 |
1 |
0 |
0 |
||
|
Std. Deviation |
6,8479930 |
2,3110373 |
4,3278536 |
4,5410121 |
||
|
Skewness |
5,530 |
5,048 |
-5,337 |
5,331 |
||
|
Std. Error of Skewness |
,421 |
,427 |
,421 |
,421 |
||
|
Kurtosis |
30,714 |
26,779 |
29,321 |
29,014 |
||
|
Std. Error of Kurtosis |
,821 |
,833 |
,821 |
,821 |
||
As it could be observed, ROS changes during period. Effectiveness of generating net income has negative meaning during crisis period and recovery was expected. Standard deviation of ROS is higher than 3, which means it isn’t spread widely. Skewness is changing and getting higher than 0, which means highly skewed. Test statistics could show how data is skewed. It could be calculated as skewness divided on its standard deviation. ROS in this research is changing, which means it couldn’t be any conclusion. Kurtosis is higher than 3, which means sample has a normal distribution, but last year it has normal distribution. And its statistic test is higher than 2, it means that it largely excesses.
Table 5 – Assets turnover descriptive statistics
|
|
Assets turnover 2013 |
Assets turnover 2014 |
Assets turnover 2015 |
Assets turnover 2016 |
|
|
N |
Valid |
31 |
31 |
31 |
30 |
|
Missing |
0 |
0 |
0 |
1 |
|
|
Std. Deviation |
,4945662 |
,4514199 |
,4105223 |
,4697508 |
|
|
Skewness |
1,895 |
1,471 |
,556 |
1,523 |
|
|
Std. Error of Skewness |
,421 |
,421 |
,421 |
,427 |
|
|
Kurtosis |
3,492 |
1,422 |
1,777 |
2,301 |
|
|
Std. Error of Kurtosis |
,821 |
,821 |
,821 |
,833 |
|
As it could be observed, assets turnover changes during period. Effectiveness of generating sales’ recovery was expected. Standard deviation of ROS is higher than 3, which means it isn’t spread widely. Skewness is changing and getting higher than 0, which means highly skewed. Test statistics could show how data is skewed. It could be calculated as skewness divided on its standard deviation. ROS in this research is changing, which means it couldn’t be any conclusion. Kurtosis is less than 3, which means sample has shorter and thinner tails and its peak is lower and broader during beginning crisis period, but last year it has normal distribution. And its statistic test is higher than 2, it means that it largely excesses.
Table 6 – Sales growth over descriptive statistics
|
|
sales growth 2014 |
sales growth 2015 |
sales growth 2016 |
|
|
N |
Valid |
31 |
31 |
31 |
|
Missing |
0 |
0 |
0 |
|
|
Std. Deviation |
,4323506 |
,4323370 |
1,5845354 |
|
|
Skewness |
2,240 |
2,238 |
3,843 |
|
|
Std. Error of Skewness |
,421 |
,421 |
,421 |
|
|
Kurtosis |
6,756 |
6,749 |
16,491 |
|
|
Std. Error of Kurtosis |
,821 |
,821 |
,821 |
|
As it could be observed, sales growth changes during period. Its standard deviation is increasing during ending crisis period. Standard deviation of sales growth is less than 3, which means it isn’t spread widely. Skewness is higher than 1, which means it is highly skewed. Test statistics could show how data is skewed. It could be calculated as skewness divided on its standard deviation. Sales growth in this research is higher than 2, which means it positively skewed and less error probability. Kurtosis is larger than 3, which means sample has a normal distribution. And its statistic test is higher than 2, it means that it largely excesses.
3.2 Correlation analysis
After analyzing descriptive statistics and concluding its normal distribution, Pearson’s correlation could be employed for defining correlation between variables. This correlation method should be used for every period. It presents relation of variables to each other, so firstly it should be determined strategy employment impact on organizational performance. Some questions would be answered when analysis would be made. Correlation output could be derived out of Pearson correlation coefficient r and significance level.
From analysis output we could see that sales growth of 1024 is related only to interest coverage ratio.
Sphere of organization is related to assets turnover ratio. Current ratio related to ROE ROA ROS.
The control variables also show some correlations with each other. This goes for leverage and efficiency, and leverage and tier 1 capital. Since leverage is also affecting performance, it could be that this is caused by the effect of efficiency or tier 1 capital. However, this cannot be concluded from the correlation matrix. The fact that some control variables are also correlating, is an indication for multi collinearity. This does not affect the direction of the effect, but could affect the size found. Therefore, it could affect the conclusions. In the next part, the most important results for thedifferent periods are discussed. These tables are due to space considerations not included in the text, but are presented in Appendix VIII: Correlation matrices, which starts at page VII of the appendix.
3.2.1 Correlation before crisis period
The total correlation table could be found in appendix an table 6. The significant results could be discussed now. It could be observed that assets turnover is strongly positively related with organization operating sphere. It supposedly related with difference on needed assets in various spheres. Operating sphere also negatively correlates on financial leverage. It would be doubt its reason. Before interpreting result it could be reminded about hypothesis
Debt ratio is negatively correlated with merger strategy. Probably its efficient not in every situation.
Interest coverage ratio is negatively correlated with debt ratio. It is strongly positively correlated with merger, which determines that it is the successful strategy for paying debt.
Customer satisfaction somehow negatively correlates with innovations. Diversification negatively correlates with staff training.
Expense changes are positively related with assets changes.
Staff training is negatively correlated with diversification, but positively correlated with ROE, ROA, ROS. Concluding, that ROE, ROA and ROS have net income in common, in that basis, staff training influence on net income.
In the basis of correlation of not all of strategy implementation, it could be said that they would be observed extended further. However other elements would be considered as well
3.2.2 Correlation during crisis
The complete matrix could be found in table 8. Below, the most important outcomes are discussed. Also during the financial crisis, it shows that some indicators are not significantly correlating. The coefficients in the correlation matrix during the crisis, are almost the same as before, when looking at the indicators and performance. Indicators show very little effects, which are mostly negative for the standard ERMRC measure, but turn into.
However, these effects are negligible. It shows that diversification and return on equity are negatively correlating, which is also found for leverage and return on assets. This are the only significant correlations between the control variables and the performance measures.
Also during this period, the control variables do not find significant relations with each other or performance. This leads to an indication that the variables do not explain firm performance. When this is confirmed, this means that no real conclusions could be drawn.
3.2.3 Correlation after crisis
Detailed correlation after crisis could be found in appendix.
In analysis outcome had been found correlation between some crisis strategies and performance indexes, also between some performance indexes and between some strategies.
Positive correlation has been observed between merger strategy and accounts payable turnover ratio. It is supposed that merger strategy helps increasing short-term liquidity.
Debt ratio correlates negatively with investment strategy and positively with reorganization strategy, which means if investments increases amount of assets that financed by debt. In case of reorganization, as more reorganization would be conducted as less would be amount of assets financed by debt.
It had been analyzed that innovation positively influences on ROE. As more innovation is employed in organization more effectively it manages and gives more profit.
It has been defined that reorganization negatively correlates with ROA, which means more reorganization would take place less effectively profit would be generated by assets.
Financial leverage is affected by innovations employed. As more innovation is employed as less financial level would be, which means less interest payments and positive affect on earnings.
Innovation strategy impacts on ROS positively, which means more innovation is employed more profit per sales is earned. Liability changes are also positively correlates with ROS.
Merger strategy is positively correlated with accounts payable ratio and debt ratio. Reorganization positively effects on debt ratio and negatively on ROA. Investment strategy is negatively effects on debt ratio and positively on investment coverage. Innovation negatively impacts on ROE, positively on financial leverage, ROS.
4. Conclusions
Conclusion derived from previous analysis is that the most impacted strategies are merger, investing, reorganizing, innovation and investing. They have their aspects.
Merger improves short-term and long-term liquidity but in increases amount of assets purchased on credit. Reorganization increases amount of credit, decreases efficiency of earning profit.
Implementation innovations brings more efficiency of profit earning, less interest payment, which derives to increase profit, and raise of profit per sale.
Investment strategy decreases amount of assets purchased in credit, increases efficiency of debt payment, increases net profit and profit per sale and decreases interest expenses.
References
- Curran, J. Small Business Strategy, International Encyclopedia of Business and Management. – In Warner, Edition. – Routledge, London and NY: International Thompson Press, 1996.
- Rones, Response to Recession: Reduce Hours or Jobs? // Monthly Labor Review. – 1981. – October, 3–11.
- Shama, Marketing Strategies During Recession: A Comparison of Small and Large Firms // Journal of Small Business Management. – 1993. – № 31 (3). – pp. 62–72.
- Michael , Robbins D. Retrenchment among Small Manufacturing Firms during Recession // Journal of Small Business Management. – 1998. – № 36 (3). – pp. 35–45.
- Dedee, J., Vorhies, Retrenchment Activities of Small Firms During Economic Downturn: An Empirical Investigation // Journal of Small Business Management. – 1998. – № 36 (3). – pp. 46–61.
- Geroski, A., Gregg, P. Coping with Recession: UK Company Performance in diversity. – Cambridge: Cambridge University Press, 1997.
- Leadbeater, C., Meadway, J. Attacking the Recession: How Innovation Can Fight the Downturn // NESTA Discussion – 2008.
- Judd, , Lee, C. Financial Concerns and Business Strategies During Inflation/Recession: Perceptions by Business Owner/Managers // Journal of Small Business Management. – 1981. – № 19.
- Churchill, N., Lewis, Lessons for small business from the recession // Journal of Small Business Management. – 1984. – № 22 (2). – pp. 5–17.
- Barrett, G. Survival tactics for a business slowdown // Journal of Accountancy. – 1990. – pp. 40–44.
- Altany, Survival lessons // Industry Week. – 1991. – № (240 (30). – pp. 57–65.
- Measure performance and set targets [Electronic source]. – 2009. – URL: http://www.infoentrepreneurs.org/en/guides/measure-performance-and-set-targets/ (accessed: 04.2017)
- Monetary Policy of the Republic of Kazakhstan to 2020.
- Sergey Zelepikhin, Decline of the foreign trade turnover of Kazakhstan hits new records [Electronic source] // Kaztag. – 2017. – URL: https://www.kaztag.kz/en/standpoint/detail.php?ID=515595 (accessed: 12.03.2017)
- Whittington, R. Recession Strategies and Top Management Change // Journal of General Management. – 1991. – № 16 (3). – pp. 11–28.
- Geroski, A., Gregg, P. Corporate Restructuring in the UK during the Recession // Business Strategy Review. – 1994. – № 5 (2). – pp. 1–19.
- Cyert, , March, J. A Behavioral Theory of the Firm. Englewood Cliffs. – New Jersey: Prentice Hall, 1963.