Purpose – the purpose of the research is to figure out whether applying drones have potential for remote sensing of plough lands in Almaty province of the Republic of Kazakhstan.
Methodology – the research method is deductive epistemology.
Originality/value – the practical significance of the research is to define what benefits using drones for remote sensing can bring for using plough lands which may help to decide for economic agents to decide for themselves whether they need a drone or remote sensing.
Findings – the research results show that applying drones for remote sensing may help to create true colour mosaicked, false colour infrared, greyscale Normalized Difference Vegetation Index (NDVI) images that may make planning and decision making easier towards organising activity around plough lands
The plough lands play the significant role in maintaining the food security of the nation [1]. Moreover, the city of Almaty, which is the biggest megapolis of Kazakhstan, is surrounded by Almaty province and requires the significant amount of food [2]. Therefore, finding new methods by testing whether they improve efficiency of using plough lands has the importance [3].
The figure below illustrates area of plough lands in the Republic of Kazakhstan between 2010 to 2016 compared to the same indicator in 2005.
The first quartile between 2010 to 2016 for area of plough lands in Kazakhstan equals to 21136.85 thousand hectares. The third quartile for the same time period is 21354.85 thousand hectares. Therefore, the interquartile range for 2010-2016 is 218 thousand hectares. The mean for the total area of plough lands in the Republic of Kazakhstan for the period of time between 2010 to 2016 is 21244.6 thousand hectares. The figure above defines that the highest indicator between 2010 to 2016 takes place in 2016 – 21473.6 thousand hectares which is 450.7 thousand hectares or nearly 2.144% bigger than in the previous year. Moreover, the highest rate of the indicator rise for the same period takes place in 2016.
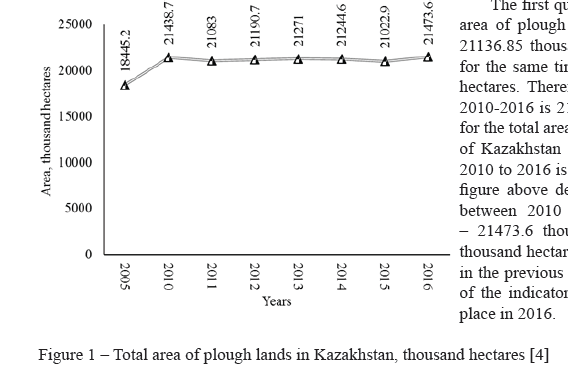
Figure 1 – Total area of plough lands in Kazakhstan, thousand hectares [4]
The indicators dropped for 2010-2016 years three times: in 2011, in 2014 and in 2015.
The highest drop for area of plough lands in the Republic of Kazakhstan between 2010 to 2016 occurred in 2011 – nearly 1.569% decline or drop by 355.7 thousand hectares.
The case study of this research is Almaty province, there, the figure below shows the area of plough lands in that province.
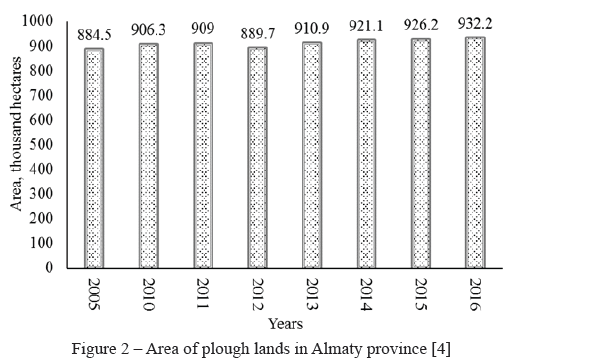
Figure 2 – Area of plough lands in Almaty province [4]
The figure above shows that area of plough lands in 2016 has grown by nearly 6 thousand hectares compared to the previous year.
The first quartile for 2010-2016 in terms of plough land areas in Almaty province equals to 907.65 thousand hectares. The third quartile for the same period of time for area of plough lands is 923.65 thousand hectares. Therefore, the interquartile range for area of plough lands in Almaty province of the Republic of Kazakhstan for the period 2010-2016 is 16 thousand hectares. The mean for area of plough lands between 2010 to 2016 in Almaty province is 910.9 thousand hectares.
The figure below shows the share for plough lands in Almaty province compared to Kazakhstani indicator.
Figure 3 – The share of Almaty province in the Republic of Kazakhstan for area of plough lands, % [4]
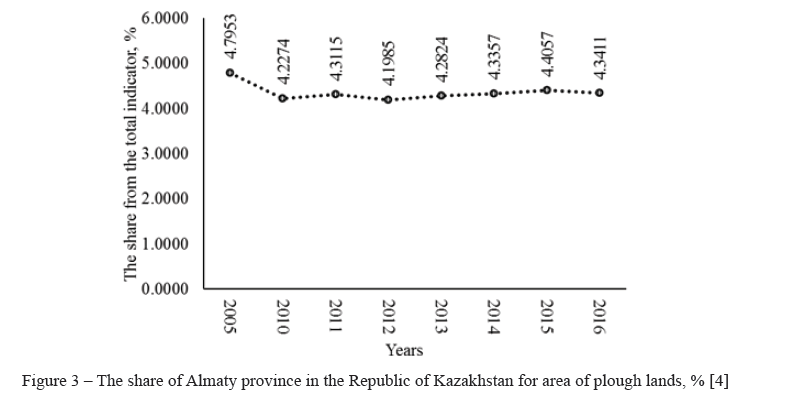
Figure 3 shows that the first quartile for the first quartile between 2010 and 2015 equals to 4.2549%. On the other hand, the third interquartile for the share of plough lands in Almaty province compared to Kazakhstani indicator is 4.3384%.
Applying unmanned aerial vehicle, which are also known as drones, have the strategic potential for remote sensing and samples of them is shown by the figure below.
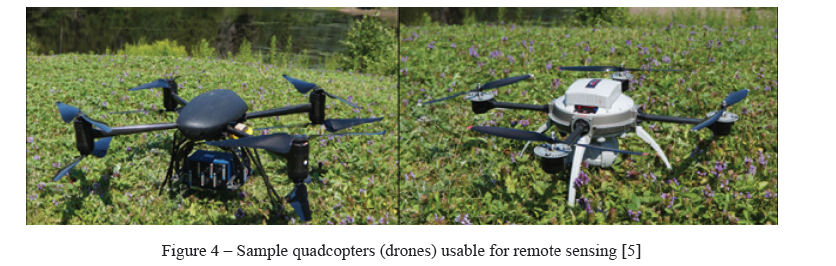
Figure 4 – Sample quadcopters (drones) usable for remote sensing [5]
The figure above illustrates Aeryon Scout model on the top which has infrared ADC type camera. On the other hand, Dragan Flayer X-8 model is shown in the bottom which has mini-MCA type camera. Both of these drones are currently used by Nipissing University in Canada [5].
The remote sensing devices take images close to the surface which may give significantly high spatial resolution. However, the single image may not cover big areas at once. Therefore, stretching together tens of individual images together using the special software is the normal practice [6]. On the other hand, there is no need to take more than one image if only small area of plough lands is needed to be accessed.
The figure below shows true colour mosaicked sample of plough land taken from the drone.
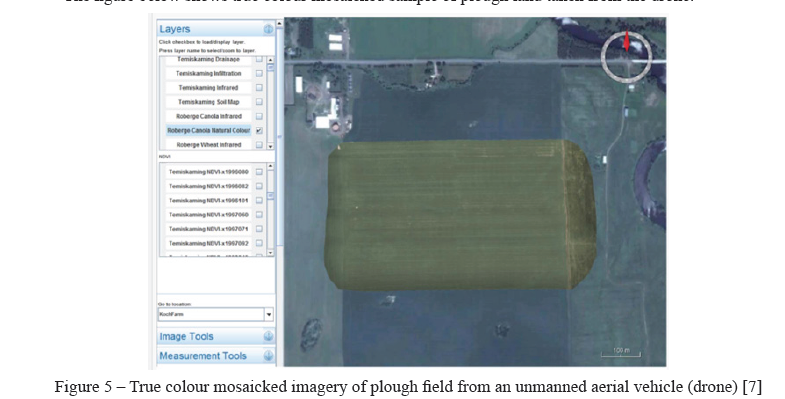
Figure 5 – True colour mosaicked imagery of plough field from an unmanned aerial vehicle (drone) [7]
The figure above shows that a drone may help to determine the borders of economic activity in details.
According to Zhang et al. (2014) an unmanned aerial device is known as Aeryon Scout which is produced by Aeryon Labs Inc. in Canada [8].
This device can be equipped:
- with Photo3S camera which has three RGB bands;
with the infrared such as ADC-lite Tetracam which can offer red, green and near infrared The figure below shows the same place taken as in the figure above but in false colours.
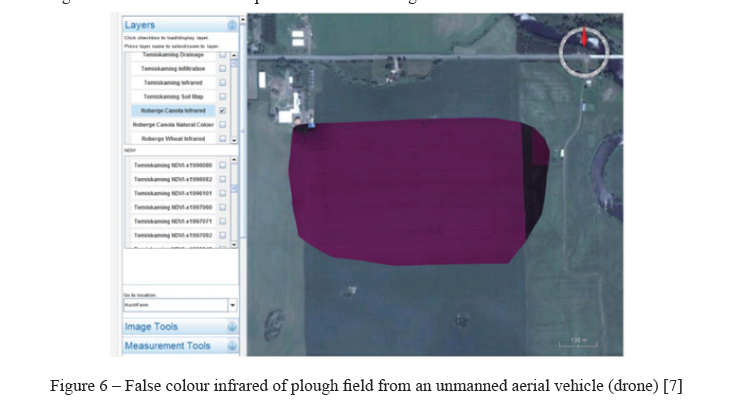
Figure 6 – False colour infrared of plough field from an unmanned aerial vehicle (drone) [7]
The figure above shows that while applying infrared photo there is the possibility to give up natural colour to make easy detecting features that may be harder to notice otherwise.
The figure below shows the efficiency of false colour in more details.
![True colour of vegetation compared with false colour [9] The figure above shows that false colour allows better segmentation of plants and soil.](/uploads/data/files/pics9/7_30.png)
Figure 7 – True colour of vegetation compared with false colour [9] The figure above shows that false colour allows better segmentation of plants and soil.
The figure below shows that the greyscale image of the area which has agricultural potential.
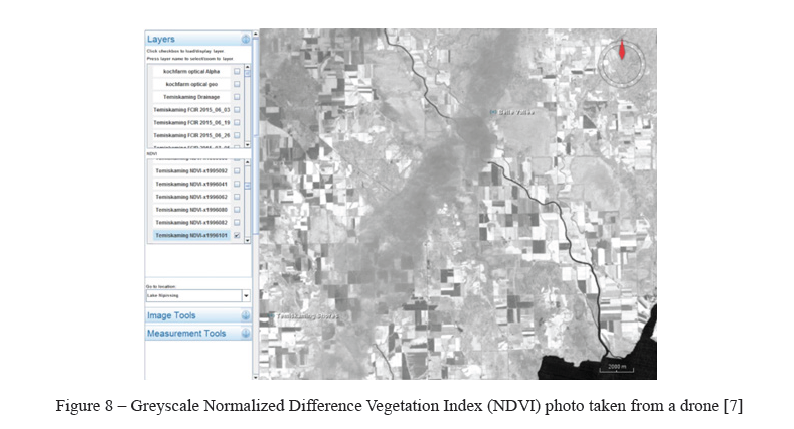
Figure 8 – Greyscale Normalized Difference Vegetation Index (NDVI) photo taken from a drone [7]
The figure above shows an image from a drone which may help to find out how much vegetation is in the local area. Moreover, making greyscale image creates potential of making the pseudo-colour soil map for defining the agricultural potential as shown in figure below.
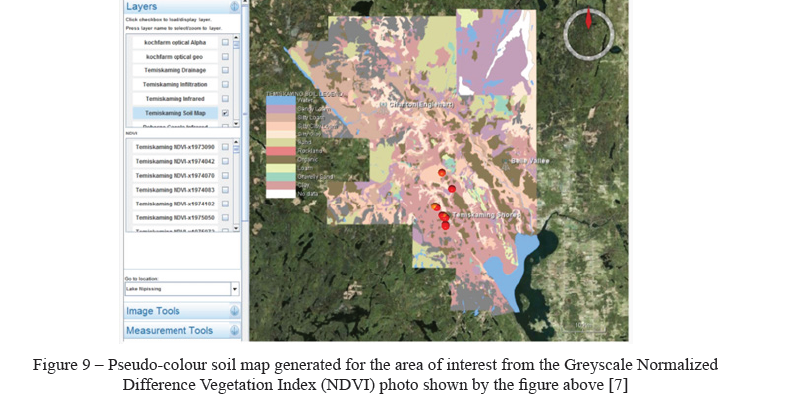
Figure 9 – Pseudo-colour soil map generated for the area of interest from the Greyscale Normalized Difference Vegetation Index (NDVI) photo shown by the figure above [7]
The figure above shows that pseudo-colour image may help to differentiate different types of soil for planning the agricultural activity. For instance, it is better to avoid making plans of growing grain in the rockland in order to avoid additional costs for creating a new plan after the presence of rockland was discovered. In addition, remote sensing of yield map may help to identify the specifics of the local environment for growing different types of agricultural cultures as shown in the figure below.
Abbreviations:
- green colour – high yield;
- yellow colour – medium yield;
- red colour – low yield.
The figure 7 shows that there is the potential of displaying maps for yields in coloured spheres which may variate from green, which indicates high yield level, to red, which shows low yields. However, it is not always easy to identify yield level of the particular square of the image in true colour. Therefore, combination of false colour infrared, greyscale normalized difference vegetation index (NDVI) and the specific computer programmes and algorithms may be required to generate the pseudo-colour map. For instance, GeoVisage programme allows the following effects [10]:
- transparency for pictures;
- greyscale conversion and transparency;
- “band swapping”;
- false colour;
pseudo-colour.
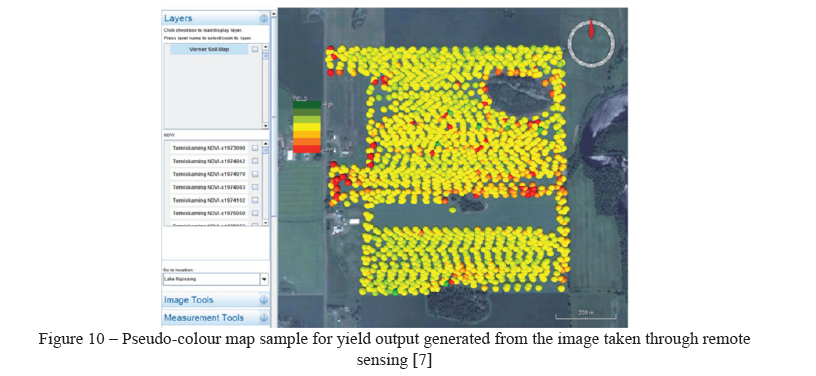
Figure 10 – Pseudo-colour map sample for yield output generated from the image taken through remote sensing [7]
Remote sensing based on drones may not give the complete picture about the environment without the weather station which sample is shown by the figure below.
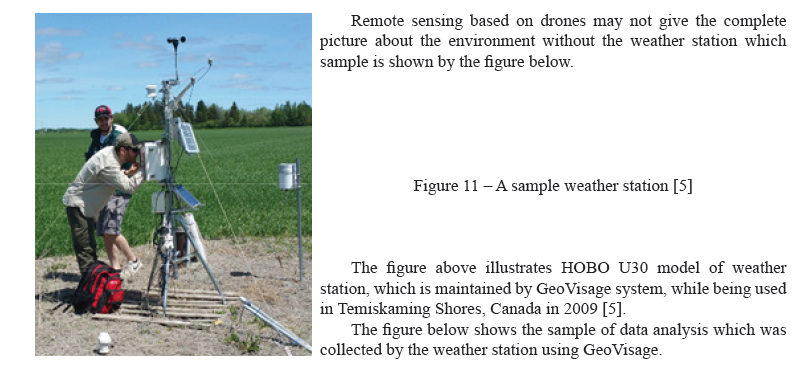
Figure 11 – A sample weather station [5]
The figure above illustrates HOBO U30 model of weather station, which is maintained by GeoVisage system, while being used in Temiskaming Shores, Canada in 2009 [5].
The figure below shows the sample of data analysis which was collected by the weather station using GeoVisage.
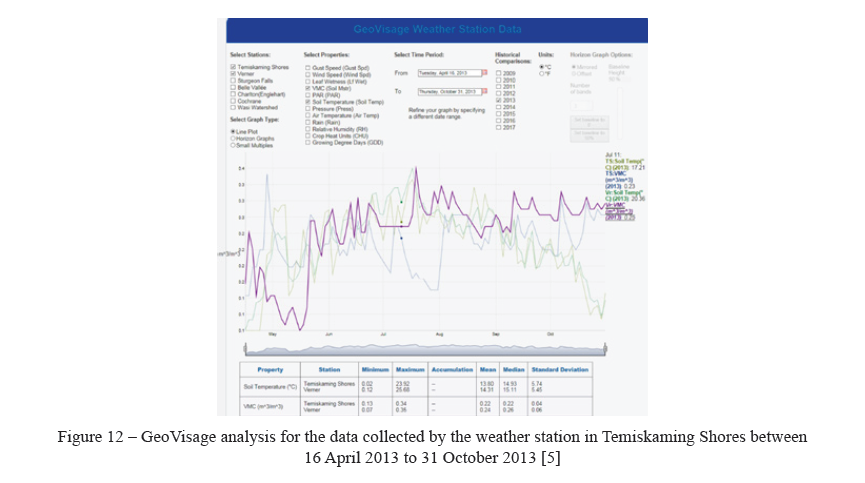
Figure 12 – GeoVisage analysis for the data collected by the weather station in Temiskaming Shores between 16 April 2013 to 31 October 2013 [5]
The figure above shows that the median for soil temperature in Temiskaming Shores is 14.93ºC. On the other hand, soil moisture also plays significant role for the crop yield [11].
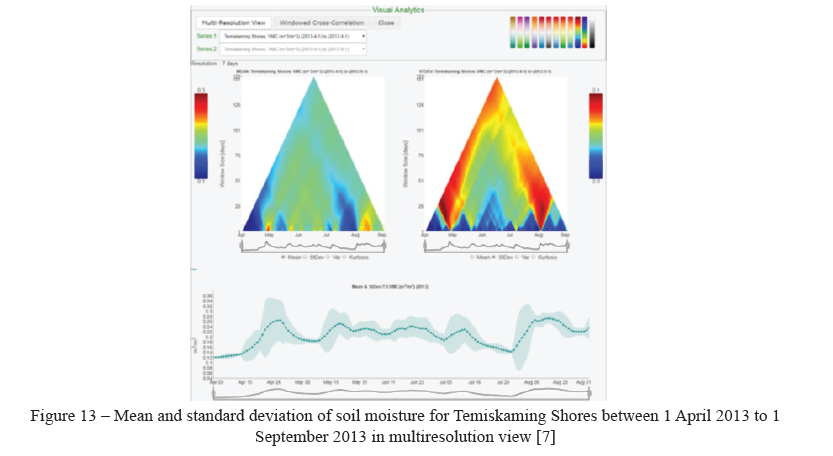
Figure 13 – Mean and standard deviation of soil moisture for Temiskaming Shores between 1 April 2013 to 1 September 2013 in multiresolution view [7]
The figure above illustrates mean and standard deviation for soil moisture as the heat map matrix representation.
Leaf wetness and wind speed also may have significance for plough lands, which sample is described by the figure below [7].
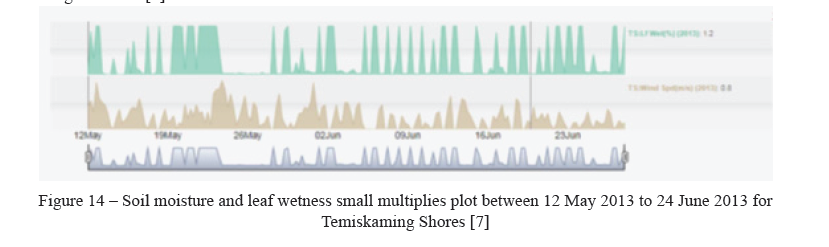
Figure 14 – Soil moisture and leaf wetness small multiplies plot between 12 May 2013 to 24 June 2013 for Temiskaming Shores [7]
The figure above illustrates optimal times for spray application so this action may hit the required target. The next step is comparing soil moisture with soil temperature which sample is shown by the figure below.
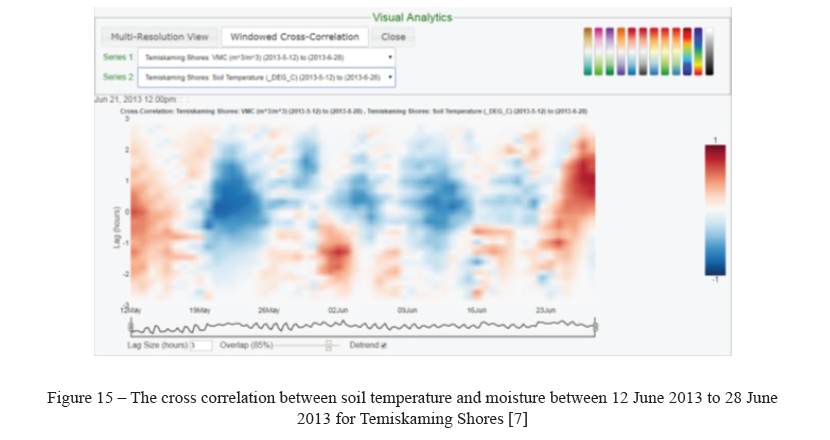
Figure 15 – The cross correlation between soil temperature and moisture between 12 June 2013 to 28 June 2013 for Temiskaming Shores [7]
The figure above defines that soil temperature and soil moisture are negatively correlated.
In conclusion, applying of drones for remote sensing has the competitive advantage for enterprises involved with plough lands in Almaty province: better planning, convenience, more detailed data of the local area for decision making. Moreover, development of IT and of drones industry is going to make the cost of drones even cheaper in the near future [12].
Список литературы
- Rahmato, , Pankhurst, A., & Uffelen, J. Food Security, Safety Nets and Social Protection in Ethiopia // Addis Ababa: Forum for Special Studies. – 2013.
- Economic and Social Commission for Asia and the Pacific Sustainable Agriculture and Food Security in Asia and the – The Washington, D.C.: United Nations Publication, 2009.
- Moon, D. The Plough that Broke the Steppes: Agriculture and Environment on Russia's Grasslands, 1700-1914. – Oxford: Oxford University Press,
- Комитет по управлению земельными ресурсами Министерства сельского хозяйства Республики Казахстан. Сводный аналитический отчет о состоянии и использовании земель республики Казахстан за 2016 год. – Астана,
- Jarvis, D., Wachowiak, M., Walters, , Kovacs, J. (2017) Adoption of Web-Based Spatial Tools by Agricultural Producers: Conversations with Seven Northeastern Ontario Farmers Using the GeoVisage Decision Support System // Agriculture. – 2017. – № 7 (8). – pp. 1-22.
- Lees, , Quaife, T., Artz, R., Khomik, M., Clark, J. (2017) Potential for using remote sensing to estimate carbon fluxes across northern peatlands – A review. – URL: https://ac.els-cdn.com/S0048969717324464/1s2.0-S0048969717324464-main.pdf?_tid=bcdeb642-cb1b-11e7-9323-00000aab0f26&acdnat=1510870745_ e9bf424b98a9fa5636416c455ba32796 (accessed: 03.10.2017)
- Wachowiak, , Walters, D., Kovacs, J., Wachowiak-Smolíkova, R., James, A. Visual analytics and remote sensing imagery to support community-based research for precision agriculture in emerging areas // Computers and Electronics in Agriculture. – 2017. – № 143. – pp. 149-164.
- Zhang, C., Walters, , Kovacs, J. Applications of Low Altitude Remote Sensing in Agriculture upon Farmers' Requests – A Case Study in Northeastern Ontario, Canada // PloS ONE. – 2014. – № 9 (11). – DOI. Org/10.1371/Journal.Pone.0112894
- Hernández-Hernández, J., García-Mateos, G., González-Esquiva, J., Escarabajal-Henarejos, D., RuizCanales, A., & Molina-Martínez, J. (2016) Optimal color space selection method for plant/soil segmentation in agriculture // Computers and Electronics in Agriculture. – 2016. – № 122. – 124-132.
- Belair, , Frigaard, I., Kunze, H. Mathematical and Computational Approaches in Advancing Modern Science and Engineering. – London: Springer, 2016.
- Hanson, , Orloff, S., Sanden, B. Monitoring Soil Moisture for Irrigation Water Management. – Oakland, California: ANR Publications, 2007.
- Završnik, A. Drones and Unmanned Aerial Systems: Legal and Social Implications for Security and Surveillance. – New York: Springer,