This article examines issues related to the assessment of the competitiveness of enterprises, in particular, the oil refining industry. The technique of the chain of value added, which assesses the prospects of their state and development, is considered. Also, the article describes the tasks of managing the value chain, the solution of which will lead to the achievement of the main objective of the enterprise, which will entail an increase in the investment attractiveness and competitiveness of the enterprise. The paper gives an example of an assessment of key segments of KazMunayGas business: extraction, transportation, processing, the structure of the value chain and its change in dynamics are also considered. The dependence of investment attractiveness and competitiveness on the value and composition of value added was established and confirmed, and the sequence of the procedure for analyzing the value added was refined and the indicators reflecting the current state and position of the enterprise in the market from the point of view of consumers and competitors were specified. This technique allows you to solve several tasks, in particular, clarifying the value of the assets of the corporation.
Introduction
The term «added value» in recent decades has become one of the most interesting, elaborated and significant concepts for economists and theoreticians. This is due to the new requirements of the domestic analytical complex to the organization of the accounting process of cost indicators, its convergence with the requirements of the national accounting system.
The problem of assessing the investment attractiveness and competitiveness of objects is increasingly actualized with the growth of the number of market transactions, the development of forms of economic relations, and the need to evaluate the value of the firm. There are many theoretical and methodological concepts and methodological approaches to assessing the investment attractiveness of companies that take into account both macro and microparameters of the facility. The subject of our study was a method based on an analysis of the structure of value added. The value chain analysis (DPC), popularized by Michael Porter in 1985 [1], is aimed at investigating the sequence of transactions that result in an increase in the value of products and services that are undergoing different stages of development and processing. Value added is understood as the value created in the process of production by a certain company and reflecting its real contribution to the creation of the value of its final products. It is calculated as the difference between total sales revenue and the amount of prime cost of resource extraction or the cost of purchasing a resource from third- party firms. That is, simplistically speaking, value added is the cost of output «at the output» minus the cost of the resource «at the input». It should be taken into account that all this added value is not formed at a time but is built up as labor is applied in the production process, that is, when the latter passes through all stages of the value chain. Analysis of value chains is an important method for assessing the competitiveness of companies and their investment attractiveness, having a lot of advantages. Its results usually convince potential investors much more than other evidence and justification. It is closely connected both with the financial and economic aspect, and with the marketing one, uniting them into one. Such an analysis can be carried out both for individual companies, clusters of interrelated companies, and for individual sectors (within and outside national boundaries). To increase the accuracy of the assessment of the investment attractiveness of objects, it is necessary to clarify the methodological sequence of the analysis of the CDS, the specifics of the conduct, including sectoral, as well as possible difficulties in the application.
Literature review
The developers of the classical concept of surplus value, which is a continuation of the labor theory of value, are A. Smith and D. Ricardo, however K. Karl Marx (Economics of the enterprise: textbook / under the editorship of Shvandar V.A. - M.: Banks and stock exchanges, UNITY, 1998). The labor theory of valuewas the basis of the teachings of A. Smith, who determined the value in the form of labor expended and the exchange of goods, that is, the number of labor resources contained in it. It is hired workers in the implementation of their labor create a new value, they also receive part of it back in the form of wages, the rest of the created value - profit, is the property of the investor of capital.
A. Smith, in his work «An Investigation of the Nature and Causes of the Wealth of Nations», asserted: «The value that the workers add to the value of materials, is falling apart ... into two parts, one of which goes to pay wages and the other to pay a profit their entrepreneur for all capital, which he advanced in the form of materials and wages» [2].
Labor is the only commodity that can produce a new value greater than its own. This explains the phenomenon of «surplus value», that is, an increase in value at the end of the labor process in relation to its beginning.
A. Smith believed that it is the costs that are needed on an average for the production process to determine the value of the cost, and not the actual labor costs of a particular commodity producer. He also noted that skilled and complex work creates more value in a unit of time than unskilled and simple, and can be reduced to the latter by means of coefficients [3]. The formula presented in the labor theory of the value of A. Smith [4].
The theory of labor value can be traced in the writings of economist D. Ricardo. He denies the idea of «productivity of capital» and the concept of land as a source of rent. D. Ricardo defines interest and rent as a deduction from the profits necessary for an industrial capitalist, paid to him by the owner of loan capital and to the landowner, while he considers profit, loan interest and rent in conjunction with the concept of surplus value. D. Ricardo agreed with A. Smith in the sense that the employee, in the exercise of his labor function, creates a value higher than his wages. He does not consider this a fact that must be carefully analyzed and studied. From his point of view, only the ratio of wages and profits is important from the value created by the worker.
D. Ricardo in his scientific work «The Beginning of Political Economy and Taxation» set forth a law according to which the indicators of wages and profits are in inverse proportion to the dependence. The book states the following conclusion: «What proportion of the product is paid in the form of wages is a matter of the utmost importance when studying profit. For it must immediately be noted that the latter will be high or low in the same proportion as low or high wages» [5].
Another author who made a serious contribution to the formation of the category of «added value» is the French economist Francois Quesnay. F. Quesnay, while studying the reproduction process, analyzed the origin of income, the exchange between capital and income, the relationship between productive and final consumption. The moment of production in his theory looked like this: «the circulation between two large subdivisions of industrial labor - between the production of raw materials and industry» [6]. He built the «Economic Table», the creation of which was conditioned by a number of assumptions, containing a significant number of assumptions. For example, since the main problem in the reproduction process F. Quesnay considered the realization of the social product, he considered the movement of commodity capital, finding the correct economic tact, in analyzing social reproduction. The crop for a year became a starting point in the analysis of the reproduction process, and its distribution and movement in the natural and monetary forms between the classes identified by F. Quesnay became the object of his study.
The foundations of the theory of the modern EVA concept were laid by economists A. Marshall and N. Scovell, whose views on the category of «added value» had already been examined in the framework of the dissertation research, and were studied in detail by B. Stewart in the work «The Quest For Value: a Guide for Senior Managers», and the work of D. Young and S. O'Birne «EVA and Value-Based Management: a Practical Guide to Implementation». The results of the implementation of certain provisions of the concept of economic added value in the activities of enterprises were devoted to the works of R. Bowen, G. Biddle and S. Weaver.
Economic Value Added - EVA is a concept of economic value added, which is based on the main objective of the activity of any enterprise - maximizing revenues. Previously used methods of economic research did not reflect the relationship between the incentive system and the efficiency of the enterprise. Evaluation of the effectiveness of the American company Stern Stewart & Co in the late 80's. XIX century was implemented with the use of the value of economic added value. On it, incentive schemes for managers were developed and subsequently applied, reflecting the existing dependence of the indicators of economic added value and enterprise value [7].
The founder of the second basic concept with respect to the category of «added value» is the representative of the French [8] economic thought and supporter of economic ideas of A. Smith Jean Baptiste Say. In the creation of his concept, despite the similarity in worldviews with A. Smith, J.B. Say abandoned the elements of the labor theory of value, which are basic in the writings of A. Smith. According to J.B. Say, the value is determined to a greater extent by the following three factors: the usefulness of the commodity, the costs of its production, supply and demand. The cost directly depends on the changes in demand and has an inverse dependence on supply. Price is the result of the mutual influence of supply and demand. In a competitive environment, prices are reduced until the amount of the cost of production is reached, while the sum of production costs is the payment of productive services, that is, the aggregate of wages, profits and rents.
Main part
From the definition of added value it is clear that it is created by a number of operations and reoperations, that is, the stages of production of a product or service, from exploration and extraction of minerals, design work to shipping and delivery of the product, all the more so if there is a change its quality.
The problem boils down to:
- assess the value added as a whole;
- assess the contribution of each of the stages of the creation of the CDS, its structure;
- assess the opportunities for growth and prospects for each repartition and in general for the company.
The value added represents a co-value:
VA = SP-CP, where the joint venture - is the cost of the finished product «at the output», CP is the cost of resources «at the entrance».
To determine what the contribution of each stage to the value-added company, you need to calculate the difference between the cost of output and the input resource for each of its segments of activity. However, here we are faced with the difficulty that if revenues from sales for each of the segments are known (reflected in the segmental attribution of the Company), then the cost of «incoming» raw materials and materials for each of the segments separately is not fixed anywhere. Nevertheless, it is clear that it is included in the total amount of expenses of a particular segment, while compiling a significant part of them.
Consequently, another value is included in the formula for calculating the value added, and we get: the cost of output «at the output» of the segment minus the sum of the cost of the resource «at the input» and other costs of the segment. And this is nothing more than the gross profit of the segment. Thus, it turns out that the added value for each of the segments is factually somewhat larger than the gross profit of the corresponding segment. In this case, the proportion of the segments' shares relative to the entire value chain is preserved. Consequently, it is permissible and justifiable to use the indicator of its gross profit as a way of determining the segment's share in the total value added of the Company.
The added value, unlike the profit indicator, coordinates interests not only corporate, but also state character, since it takes into account the requirements of the legislation on providing social and environmental guarantees. There are two most important from the point of view of the theoretical basis of the option of determining the value added: using the addition method and the subtraction method (Fig. 1).
Within the addition method, the added value is calculated using an indirect additive method. Moreover, the added value is determined by the addition of the following elements: labor costs for various categories of workers, the amount of taxes that are included in the cost of production and insurance premiums from the amount of accrued wages, the rate of profit put into the cost of selling products by the enterprise. The information base for the implementation of this method is a set of accounting data in which such an indicator as «value added» is not used. The value added value, which is calculated by statistical bodies, can be used for evaluation and analysis purposes only if it is regularly calculated, at least monthly and according to a single methodology approved for all enterprises [9].
There is another option for calculating the value added by applying the addition method. In this method, added value is the amount of depreciation accrued from the value of fixed assets and intangible assets, the wages of various categories of employees, insurance premiums accrued from it, and the amount of profit that the enterprise pawns as part of the production of a particular type of product.
The second method of determining the amount of added value is the subtraction method. This method has two varieties: a direct additive method and a direct subtraction method. The essence of the direct additive method is that the added value is the difference between the proceeds from the sale of products and intermediate consumption (the cost of raw materials, materials, services rendered for the needs of production) [10].
Today, most economists use the direct additive method or, as it is also called, direct accounting method when calculating the «added value» index, that is, when determining its value, the main elements are revenue (including VAT) and material costs. The application of this method is possible only in the case of calculating an indicator of value added on the basis of accounting data shows the algorithm for calculating the added value of the direct additive method. In the subtraction method, there is also a direct subtraction method. By this method, you can also determine the amount of value added. To do this, it is necessary to deduct the value of the value-added tax from the value added (VAT included):
The use of an indirect method of subtraction does not imply the determination of the value added, since the main purpose of this method is the calculation of value added tax, with the tax rate being applied to the value of the sold products (works, services) and to the value of the goods (works, services) [11].
An indirect method of subtraction is used to determine the value of the value-added tax, which is also called the invoice method, the method of reimbursement, in the form of a tax credit. This method provides that the amount of value added tax is calculated and paid to the budget according to the rates established by the Tax Code at each stage of production and consumption of products (works, services) up to the end user. At the same time, the amount of the value added tax accrued at the previous stage of the PP movement is equal or not written off in full, they are not accepted or are taken into account in a smaller amount, therefore, they increase the tax base for calculating the VAT of the goods, is deductible from the tax amount [12].
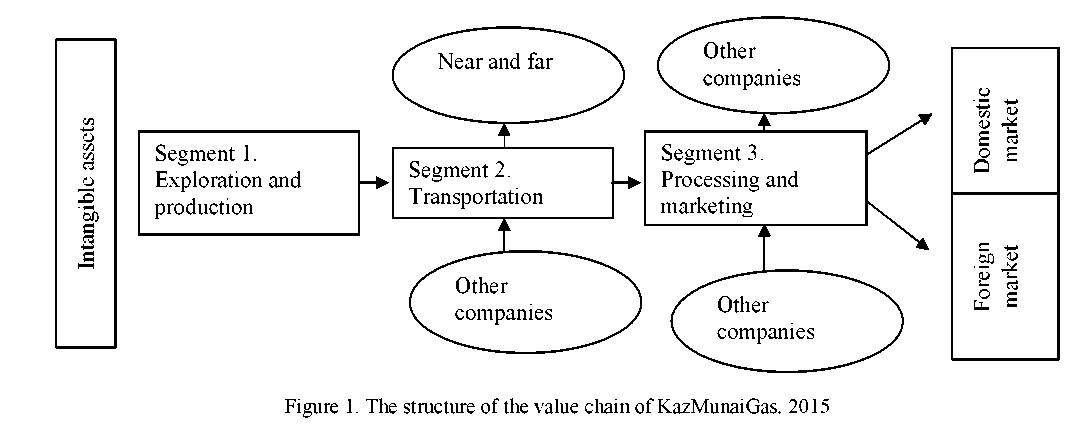
Consider the sequence of analysis and the structure of the CDS in the example of KazMunaiGas (KMG) with the purpose of assessing the investment situation of the company. KMG is a national company for exploration, production, processing and transportation of hydrocarbons, representing the interests of the state in the oil and gas industry of Kazakhstan. KMG is vertically integrated and covers the whole cycle from prospecting raw materials to marketing liquid hydrocarbons. The Company's activities cover three main operating segments, which are the stages in the value chain: - Exploration and production of oil and gas; - oil transportation and gas transportation; - processing and sale of crude oil and petroleum products. The main share (about 85 %) of oil produced is exported, the main foreign trade partners of Kazakhstan in the crude oil market are the countries of Europe — Italy, Netherlands, France, etc., and China.
Segment 1. Exploration and production — search, evaluation and preparation of deposits for development. Oil and gas supply to the surface.
Segment 2. Transportation — transportation of oil to refineries and consumers of sea and pipeline transport. Replacement of gas by pipeline transport.
Segment 3. Processing and marketing — production of petroleum products. The realization of crude oil and petroleum products to consumers. Sales of commodity gas. In Figure 1 shows the value added chain in KMG, as well as the shares of each of the stages in percentage terms as of 2015 [13].
It should also be noted that in all non-oil and gas companies, the largest contribution to the total added value is made by the production segment, since the cost of the «input» resource is minimal because oil and gas are not purchased from suppliers but are extracted from the field (the cost of production is much less than the cost of purchasing oil and gas from the supplier).
Managing the value chain within the company can also have consequences at the sectoral and national levels. In a situation where the national market is in the developing stage, companies that have managed to take their niches among the first can influence not only the process of building a chain of value added within the company, but also in its niche. This influence occurs in one or more of the following areas: through the definition of the product line (marketing), through the definition of technology standards and / or technical support of smaller vendors (production process), through the introduction of standards / marketing requirements (logistics). The competitive position of the company, which was able to occupy a leading position in the niche and extend its influence on the work of other companies in this niche, is extremely strong.
Table Dynamics of oil and gas industry development indicators
|
№ |
Index |
2009 |
2010 |
2011 |
2012 |
2013 |
2014 |
2015 |
2016 |
2016 to 2009 |
|
y |
Gross Value Added - Crude oil and natural gas production; technical services in the field of mining industry |
3261,5 |
3587,14 |
4216,96 |
4460,49 |
4587,14 |
5008,16 |
4214,79 |
4671,29 |
1,43 |
|
x1 |
Manufacture of refined petroleum products |
325,9 |
340,1 |
416,97 |
582,69 |
583,57 |
516,80 |
457,92 |
494,92 |
1,52 |
|
x2 |
Population thousand people |
16101,50 |
16203,04 |
16440,12 |
16673,08 |
16909,78 |
17160,77 |
17417,67 |
17670,60 |
1,10 |
|
x3 |
Average monthly nominal wage of one employee |
75251 |
77611 |
90028 |
101263 |
109141 |
121021 |
126021 |
142351 |
1,89 |
|
x4 |
Gross domestic product by production method bill. tenge |
17007,6 |
21815,5 |
28243,05 |
31015,18 |
35999,02 |
39675,8 |
40884,13 |
46193,38 |
2,72 |
|
x5 |
The world price of oil, Brent, US dollars |
53,48 |
79,64 |
110,94 |
112 |
108,90 |
107,50 |
50,70 |
32,30 |
0,60 |
|
x6 |
Imports of bill. of US dollars |
28,408 |
31,12 |
36,9 |
46,35 |
48,8 |
41,29, |
30,56 |
25,17 |
0,89 |
|
x7 |
Exports of bill. of US dollars |
43,19 |
60,27 |
84,33 |
86,44 |
84,7 |
79,45 |
45,95 |
36,77 |
0,85 |
|
x8 |
Investments in fixed assets bill. tenge |
1002,35 |
1073,25 |
946,86 |
1000,16 |
1116,08 |
1389,82 |
1361,89 |
1809,05 |
1,80 |
The main direction of research in the oil and gas industry is to determine the efficiency and profitability of the production of this direction, forecasting the needs of products, as well as market analysis and forecasting. Forecasting of the oil and gas industry is now possible thanks to modern mathematical methods (regression and correlation). We studied the dependence of Crude oil and natural gas production (Y) on 8 factors for 2009-2016 [14] (Table):
Х1 - Manufacture of products of oil refining;
Х2 - Population thousand people;
Х3- Average monthly nominal wage of one employee;
Х4- Gross domestic product by production method bill. Tenge;
Х5 - The world price of oil, Brent, US dollars;
X6 - Imports of bill. of US dollars;
X7 - Exports of bill. of US dollars;
Х8 - Investments in fixed assets bill. tenge.
According to statistical data of factors for the period 2009-2016. Pair correlation coefficients are calculated, represented as a correlation matrix. We would like to note that the first correlation table showed a close relationship between these factors, since the linkage of factors is more than 0.9. This table shows a false correlation, because there is no economic connection between some of the content factors, and therefore, the chain growth rates of these factors (in %) in the period 2010-2016 were calculated. and the second correlation table is calculated.
According to the results of the second correlation table, it was revealed that there is a good correlation between the Gross Added Value of crude oil and natural gas production; technical services in the field of mining industry (y) and factors Gross domestic product by production method bill. tenge ryx4 = 0.77, World price for oil, Brent, US dollars ryx5 = 0.89 and indicator Export bill. US dollars ryx7 = 0, 88.
These factors directly affect the gross value of crude oil production. This can be argued by the fact that the statistics show the relationship between the growth in production and oil production with the growth of exports and GDP in the Republic of Kazakhstan. This fact is due to the raw material orientation of the country and the impact of oil prices on Kazakhstan's economic growth.
For regression analysis, we chose the growth rates of these factors: Gross domestic product by production method KZT bill. (x4), World oil price, Brent, USD (x 5) and export volume indicator USD bill (х7). If we consider the relationship between the effective characteristic and all factors, then we would like to point out that between the factors x 4, x 5 and x 7 there is a good correlation and tightness of the connection of factors, since the coefficient of multiple correlation is R = 0.80. Regression analysis shows that 64% of the changes in the gross value of crude oil production can be explained by changes in the GDP level, the price of oil in the world market and in the volume of exports to the Republic Kazakhstan (the coefficient of determination R2 = 0.64). The obtained equation can be used for the forecast and development prospects of the oil and gas industry of the Republic of Kazakhstan, since the null hypothesis about the random nature of the dependence is rejected and the statistical significance and reliability of the regression model are recognized.
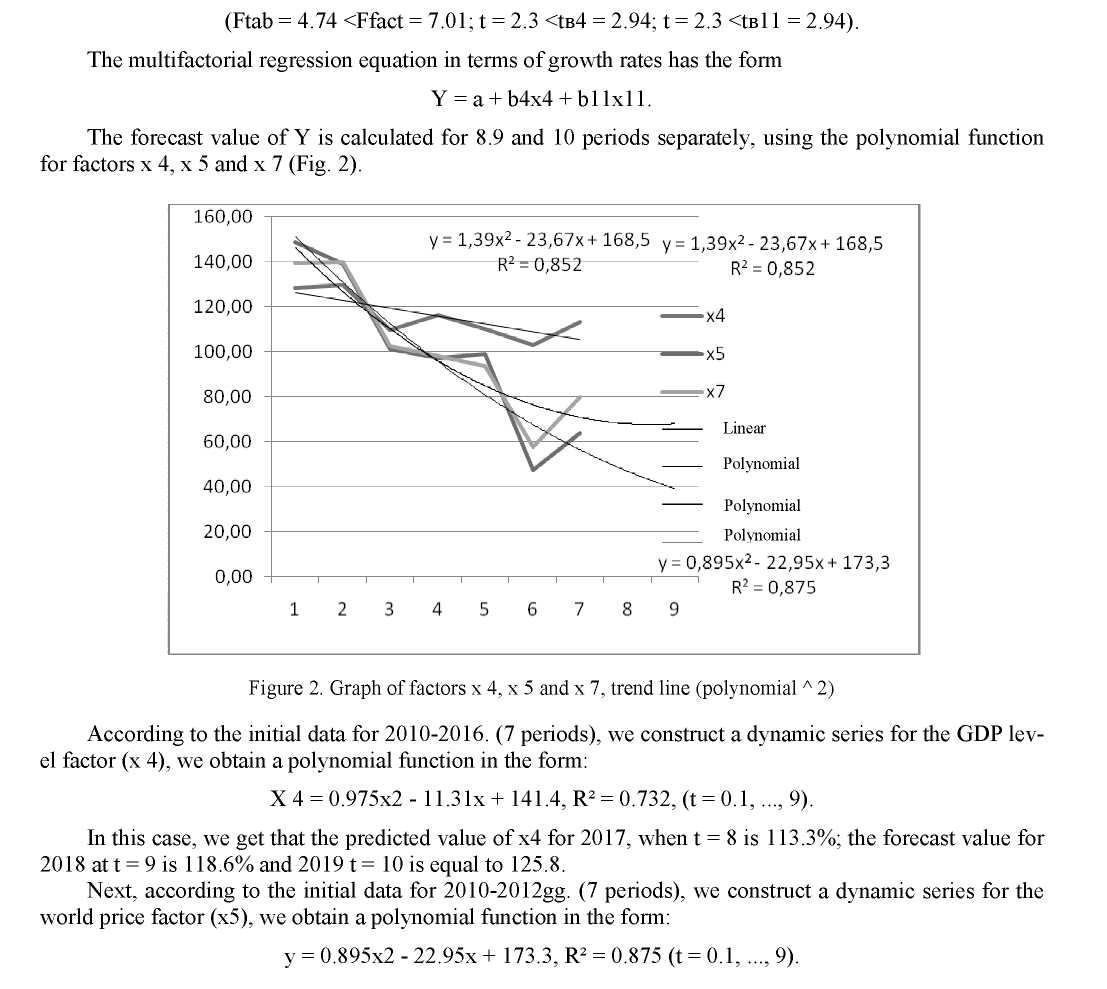
According to the polynomial function for the world price level factor (x5), the predicted value of x4 for 2017, when t = 8 is 47.0%; the forecast value for 2018 at t = 9 is 39.2% and 2019 t = 10 is equal to 33.3% of the growth.
For the following factor of export level in the RK:
y = 1.39x2 - 23.67x + 168.5, R2 = 0.852.
The projected value of X 7 for 2017, when t = 8 is 68.1 %; The forecasted increase in the level for 2018 at t = 9 is 68.06 % and 2019 t = 10 is equal to 70.8 %.
Due to the fact that at the second stage of our work, we transferred the initial data to the growth rates and used them throughout the solution, in the final part of the work we need to find the forecasted Y values for the growth rates, that is, their percentage values, and we get that Y (%) by the regression equation Y = a + Ь4х4 + Ь11х11, the forecast value for 2017 at t = 8 is 100,4053292; and by 2018 at t = 9 will be equal to 102.650613 and for 2019 t = 10 is equal to 106.09. In conclusion, I would like to note, since for the forecast for subsequent periods we need the data Y in physical terms, then through growth rates, using the equation by the property of proportion crosswise. In this case, the forecasted value of Y for the 8th period (2017) will be on average 4690224.7 million tenge, and for the 9th period (2018), on average, will be 4814544.4 million tenge. and for the 10th period (2019) on average will be 5107797.0 million tenge.
Conclusions
The added value, unlike the profit indicator, coordinates interests not only corporate, but also state character, since it takes into account the requirements of the legislation on providing social and environmental guarantees. Thus, this indicator reflects the state of the company for the analysis period. The analysis showed that the oil and gas industry is characterized by the concentration of value added during the extraction phase, as the costs of this period directly determine the further value of the product. Managing the value chain within the company can also have consequences at the sectoral and national levels.
The main direction of research in the oil and gas industry is to determine the efficiency and profitability of the production of this direction, forecasting the needs of products, as well as market analysis and forecasting.
The conducted correlation-regression analysis allowed us to make a forecast of the dynamics of the Gross Value Added value of crude oil and natural gas production. This forecast showed a growth in profit in the short term.
References
- Amirbekuly, Y. (2017). Osobennosti formirovaniia protsessov proizvodstva produktsii s vysokoi dobavlennoi stoimosti v Kazakhstane [Features of Formation of Product Manufacturing Processes with High Added Value in Kazakhstan]. Mezhdunarodnyi biznes-menedzhment – International Business Management, 11, 571–578 [in Russian].
- Smith, A. (2007). Issledovanie prirody i prichin bohatstva narodov [Investigation of the nature and causes of the wealth of peoples]. Moscow: EKSMO [in Russian].
- Kruglov, V.V., & Balakhonova, E.V. (Eds.). (2008). Istoriia ekonomicheskoi mysli [History of economic thought]. Saint Petersburg: Piter [in Russian].
- Maslova, I.A. (2003). Sistemnaia kontseptsiia ucheta i raspredeleniia stoimosti v post-transformatsionnoi ekonomike Rossii i ее adaptatsiia k mezhdunarodnym standartam finansovoi otchetnosti [The system concept of accounting and cost distribution in the post-transformation economy of Russia and its adaptation to international financial reporting standards]. Oryol [in Russian].
- Ricardo, D. (2013). Nachalo politicheskoi ekonomii i nalohooblozheniia [The Beginning of Political Economy and Taxation]. (Vol. 1.3). Moscow: EKSMO [in Russian].
- Stoliarov, I.A. (2015). Antolohiia ekonomicheskoi klassiki [Anthology of economic classics]. (Vol. 1-2; Vol. 1). Moscow: Ekonomika [in Russian].
- Sobolev, M.N. (1925). Ocherki po finansovoi nauke [Essays on financial science]. Kharkov: Izdatelstvo «Proletarii» [in Russian].
- Yangzhul, I.I. (2002). Nauka: Doktrina hosudarstvennykh dokhodov [Science: The Doctrine of State Revenues]. Moscow: Statut [in Russian].
- Vasilyeva, M.V. (2011). Normirovanie raskhodovaniia denezhnoho ekvivalenta dobavlennoi stoimosti v ramkakh hosudarstvennoi podderzhki na primere selskokhoziaistvennoho sektora [Rationing the expenditure of money equivalent value added value in the framework of state support by the example of the agricultural sector]. Upravlencheskii uchet – Managerial Accounting, 10, 3–10. Moscow: ZAO «Finpress» [in Russian].
- Gudkov, A.A., & Savkina, E.S. (2012). Sovershenstvovanie nalohooblozheniia dobavlennoi stoimosti selskokhoziaistvennykh predpriiatii s tseliu obespecheniia prodovolstvennoi bezopasnosti Rossiiskoi Federatsii [Improvement of the taxation of the added value of agricultural enterprises for the purpose of ensuring food security of the Russian Federation]. Upravlencheskii uchet – Managerial Accounting, 10, 63–68. Moscow: ZAO «Finpress» [in Russian].
- Guryanov, M.A. (2010). Formirovanie i raspredelenie dobavlennoi stoimosti v selskokhoziaistvennykh orhanizatsiiakh [Formation and distribution of value added in agricultural organizations]. Extended abstract of candidate's thesis. Moscow [in Russian].
- Malkina, E.L. (2008). Uchet formirovaniia i aktualizatsii stoimosti produktsii na osnove sistemy natsionalnoho ucheta [Accounting for the formation and actualization of the value of products on the basis of the system of national accounting]. Oryol: Orlovskii hosudarstvennyi tekhnicheskii universitet [in Russian].
- Ofitsialnyi sait AO «NK» KazMunaiGaz» [Official site of JSC NC «KazMunayGas»]. kmg.kz. Retrieved from http:// www.kmg.kz [in Russian].
- Ofitsialnyi sait Komiteta po statistike Ministerstva narodnoho khoziaistva Respubliki Kazakhstan [Official site of the Committee on Statistics of the Ministry of National Economy of the Republic of Kazakhstan]. stat.gov.kz. Retrieved from http://www.stat.gov.kz.