In this article such concept as level and quality of life has been investigated, indicators of twelve countries of the former union Soviet socialist nations have been taken and analyzed. The standard of living was compared on such indicators as GDP per capita, availability of housing, availability of loans, inflation, unemployment rate. Also during work, it was accepted to use the indicators allocating this country to understand why is there a development or what prevents it from being improved. So, for example, when studying quality of life of residents of Kazakhstan not only standard signs were studied, but also pollution level was considered by industrial wastes. It also distinguishes this article from previous ones, in it features of each country have been considered. For definition of the country with optimum conditions of accommodation the comparative analysis of indicators of statistics according to official figures of the states has been used. During comparison the schedules defining indicators of quality of life in this or that country have been visually submitted. Russia and Kazakhstan were in the top two. Tajikistan became the least attractive country for accommodation from selection
On 25th of December, 1991 Soviet Union has been divided to separate countries. After the separation of the countries each of them started to look forward for the ways to deal with the economy of each state. Some of them succeeded in the task of making the high standard of living points and some of them could not. It is for us as for economists, to see what country is in need of the improvement in this field and the ways to prevent strong countries to drop their high level. In this work, I am going to analyze the standard of living in Commonwealth of Independent States and try to find out which of the governments are making the best living condition for their citizens. Thus, very diverse regions will be analyzed and we will see many aspects of the influence of standard of living [1].
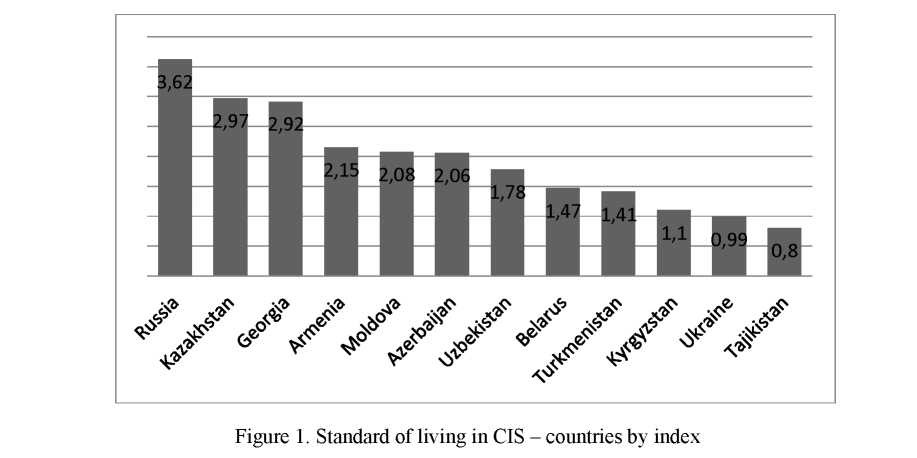
For the comparative analysis 12 states have been chosen. The standard of living was compared on the following indicators: GDP per capita, availability of housing, availability of loans and inflation (Fig. 1).
GDP per capita (in dollars, data of the IMF for 2016)
GDP indicator per capita is the GDP made by the country all divided into the number of inhabitants. GDP per capita can be considered as an important economic indicator for comparison of the average level of life and economic welfare, however it is impossible to speak about well-being of nation on one indicator.
- Coefficient of availability of housing (data from the website Numbeo)
This coefficient shows a ratio of median housing prices with the income of the population. Selection was made of ten countries.
- Availability of loans to acquisition of the real estate (data from the website Numbeo)
The indicator, the better is higher. Selection was made of ten countries.
- Inflation (data of the IMF)
Percentage growth of overall price level in annual terms. Selection was made of 12 countries [2].
From 12 analyzed countries of Russian Federation has the biggest indicator of GDP per capita. Following the results of 2016 the indicator in dollars left 8 928, or 598,722 rubles (average annual dollar exchange rate - 67,06 rubles). For the last five years of GDP per capita in the Russian Federation was reduced from 14 187 dollars in 2011 to 8 929 dollars in 2016. The greatest reduction of an indicator (from 12 countries for the analyzed period) is recorded in 2015 - 33,8 percent. This reduction has arisen because of devaluation of ruble in 2014.
Also, country became the leader in availability of housing and availability of loans to acquisition of the real estate. According to data, the indicator of availability of housing was 12,84, and availability of loans - 0,52.
Russia takes the sixth place on increase in prices level. That is from all countries of selection Russia has shown the sixth smallest indicator.
Unemployment rate in Russia for the first time in nearly three years has fallen below a mark of 5 %, follows from data of Rosstat. In August, 2017, according to official statistics, there were 3,792 million Russians at the age of 15-72 years were without work that makes 4,9 % of the total number of able-bodied population of Russia.
In the previous time unemployment rate in Russia fell below a mark of 5 % in September, 2014, having been the same 4,9 %.
Following the results of August, 2017 Rosstat has estimated the total number of labor in the country at 76,9 million people.
According to the Ministry of Labour, the total number of the unemployed who are officially registered in bodies of employment to the middle of September was nearly 754 thousand people, that approximately is 138 thousand people less than the previous year.
In a week from September 6 to September 13 the number of officially registered unemployed in Russia has decreased by 1,6 %. Decrease in number of jobless citizens has been recorded in 82 of 85 regions of the country, at the same time the largest rates the number of the unemployed decreased in Mordovia, Tatarstan, Karelia, Bashkiria, etc. In two regions: growth of number of the unemployed has been noted in the Leningrad Region and Chechnya.
In the capital the size of the average salary is 60 thousand rubles a month, in some regions it is even higher. The average salary in the country about 32 thousand rubles a month, but partially it is compensated by lower price level in the province, than in Moscow. Besides, there is still an indicator of median salary. For August, 2015 median salary in Russia makes 23 548 rubles (according to definition of a median of 50 % of the working Russians earn more than this sum, and 50 % — are less). The difference between average and median salary can be shown on the following example: one person receives 85 thousand a month, and 5 people 13, 18, 23, 28, 33 thousand a month respectively. Then the average salary at them 33,3 thousand rubles, but a half in this case receives less than 24 thousand rubles, and 83 % of workers receive less than 33,3 thousand rubles. That is less average salary receives the vast majority. The difference between average and median salary of subjects is stronger, than stratification of income in society is more.
Income tax in Russia doesn't depend on the level of income and makes 13 %. Therefore, on average poor citizens of the developed countries pay at the smaller rate, than in Russia (or nothing is paid, or pay from 5 %). The rich and the middle class pay more, than in Russia, up to 75 % of a tax.
Obligatory insurance payments of employers for workers in the pension fund, social insurance fund and fund of obligatory medical insurance in Russia make 35,6 % and are rather high, though not record. At the same time the lion's share (22 %) is made by payments in the pension fund that casts from time to time to some economists of a thought of raising the retirement age. In general the Government of the Russian Federation wants to reduce in the long term obligatory insurance payments, but to raise other taxes: «The new tax system which the president Vladimir Putin has charged to prepare can include decrease in insurance premiums, increase in the VAT».
Price level in Russia is much lower, than in the USA and other developed countries. According to the Index of Big Mac, actual dollar exchange rate took into account different price level — 23 rubles.
At the expense of it, despite salaries, modest to the western measures, really the standard of living in Russia does not so strongly differ from the West. According to OECD Better Life Index at the beginning of 2010-x the level of family income in Russia approximately corresponded to the level of South Korea. However, in connection with difficulties which are overcome by Russia real income per capita, according to Rosstat, since the publication of rating has decreased by 9,2 %. According to Rosstat in general for 2016 income has dropped by 5,9 % in real terms in comparison with 2015. In 2015 there was a decline by 3,2 %. Therefore, in connection with falling real income in Russia and their growth in South Korea, and also in connection with falling of feeling of financial wellbeing of Russians, in the same OECD Better Life Index, index in 2016 the level of family income in Russia was already 1.92 times less than in South Korea. In 2016 Russia on the level of family income in this rating was above Latvia and Turkey, but is lower than Chile and Hungary.
There is a program of housing-and-municipal subsidies in the country. The state pays money, compensating payment of their services. The situation when their cost exceeds 22 % of the income of family, in Russia is legislatively impossible.
There is one of the biggest systems of central heating in the world in Russia therefore most of Russians don't care for how to heat the room and doesn't suffer from winter cold. Moreover, heating and hot water in Russia cost little very much in comparison with many western countries. So, even Russians of very modest prosperity can often take a hot bath — and it is luxury for residents of Western Europe.
Russia is the country where the state has made a lot of things to facilitate to the inhabitants such hard work as courting for the child. After a maternity leave which is paid at the level of 100 % of a salary mother or other family member can look after the child up to three years with full preservation of a workplace and a certain percent from a salary.
And since 3 years, according to the legislation of Russia, each Russian child has to be provided with the free place in kindergarten. There are practically no turns in kindergartens in Russia, as of 2015. This law allows the Russian families to save very considerable sums of money — in many developed countries kindergartens paid.
The grant for the second child makes 475 thousand rubles. There are also regional surcharges to this sum which usually are given for the third child and make about 150 thousand rubles.
Number of doctors in Russia per capita is one of the highest in the world, therefore, to get on appointment in Russia is quite easy. Number of hospital beds per capita in Russia is one of the highest in the world as well. At the same time medical care in Russia is free. There is a long list of drugs, all medicines entering it, are obliged to give to free of charge a number of categories of the population. In addition, the prices of a number of medicines are controlled by the state. Moreover, hi-tech medical care is also provided absolutely free of charge — within quotas which general size is quite big. Where the American pays hundreds of thousands of dollars, the Russian is treated, without having paid kopeks.
In Ingushetia, autonomous republic as a part of Russia, in 2013 life expectancy has made nearly 79 years that approximately corresponds to the level of the most developed countries of the world. The general life expectancy in Russia because of the Russian tradition of smoking and alcoholism is lower, but on a gain of average life expectancy Russia is high on the list on Earth already now.
Education in Russia is free and at the same time is very qualitative. According to the TIMSS and PIRLS tests, the Russian elementary school is one of the best in the world. Russia is high on the list on Earth on percent of people with the higher education, and about 87 % of graduates go to the universities after school.
On the Law on education adopted in 2012, aged from 17 up to 30 years the state is obliged to allocate at least 800 new budgetary places for each 10 thousand people annually. So, the Russian students aren't burdened with the educational credits, unlike their peers from the developed countries. Hostels are often provided to nonresident students in the Russian higher education institutions. The talented Russian entrants concordant to work in Russia after release receive 20 thousand rubles a month for the study at the university.
The Russian students get very quality education: among winners of the international Olympic Games every year there are Russian school students and university students. In the rating of Thompson Reuters Moscow State University takes the fifth place in Europe. Positions of other Russian higher education institutions in the world rankings are slightly more modest because of other organization of scientific activity and not English-speaking environment. But recently as a result of the 5TOP100 implementation of the program of a position more than a half of the Russian higher education institutions participating in the program5TOP100 grow in the most prestigious world rankings. At the same time, according to data on the website 5TOP100 for February, 2017 the best of the Russian higher education institutions Moscow State University takes the 216th place in one of ratings. In other ratings of a position of the Russian higher education institutions is much higher: so, the rating of QS includes 28 Russian higher education institutions, at the same time the Russian higher education institutions are included into TOP 100 in all 15 directions and in top-50 - in some directions. After receiving degree of the bachelor or the master in Russia the state within the Global Education project completely pays also further study in the leading higher education institutions of the world — for those who aren't going to continue training in Russia.
In general the education level in Russia is estimated as is slightly lower than an average for the countries of OECD. «At Russians on education aged from 5 up to 39 years, 16,1 years leave on average, that is below an average value on OECD (17,5 years)». «In testing of literacy of reading, knowledge of mathematics and natural sciences in Russia pupils have gained on average 481 points that below an average value on the OECD equal to 497 points». According to OECD Better Life Index on education level for 2016 Russia was above Greece and Great Britain, but below Hungary and Austria Though positions of the Russian schools in testing of TIMSS and PIRLS remain on one of the first places in the world, positions in testing of PISA remain at quite average level what such assessment is connected with. However, certain Russian regions, in particular, Moscow, show results at the level of world leaders and in this test [3].
The retirement age in the Russian Federation — one of the lowest in the world, at the same time a considerable part of pensioners retire even earlier. Despite it, the Government of the Russian Federation cares for pensioners. The Government of the Russian Federation has carried out valorization of pensions to the most difficult years of the global financial crisis, having multiply increased their size — and their size in the next years has continued to grow quickly, as in nominal, and in real terms. Pension of the veteran of the Great Patriotic War, for example, by the sizes comes very close today to the average salary, at a number of categories of the population pension is even higher because of various regional and professional extra charges. Today in the Russian Federation there is a law according to which in Russia there shouldn't be a poor pensioner. Each pensioner, whose pension falls short of the level counted Rosstat considerably exceeding the poverty threshold counted the World Bank receives the surcharges raising his pension to this level.
Taking all this into account, as the Government of the Russian Federation it is recognized that social guarantees in Russia — one of the highest in the world.
For this reason on number of the migrants coming to the country Russia takes the second place in the world. More and more people from the most different corners of the globe want to live as richly as Russians. Here, emigration from Russia to other countries was reduced many times over: people don't want to leave Russia.
For this reasons, in the winter of 2011 — 2012 in Russia there have taken place protest meetings, protesters didn't make any social and economic demands, and made political demands. Apparently, in Russia most of people and so has salaries, decent to world measures and in addition to it there is an enormous social sphere in the country.
In 2017 the UN, in the report of 2016, analyzing data for 2015, for the first time Russia has officially placed in the list of the countries with very high level of the Index of Human Development (IHD). It is also necessary to note that Russia was strongly brought earlier by low life expectancy. As a part of IRChP three indicators: income, education, life expectancy. Now, when life expectancy in Russia has almost reached average life expectancy in the world, the negative impact of this factor on IRChP has decreased [4].
At the same time, the standard of living in Russia still is theplace to grow. To reach further improvements in life, Russians need to increase efficiency of work, to create and take highly paid jobs, to develop domestic market and import replacement, to fight against overconsumption of alcohol and other addictions more actively, to join a healthy lifestyle and to revive family values. Really high standard of living can be reached under following conditions: first, having strong family, on the second place — satisfactory health, on the third — good work. Certainly, not only the government of the country, but also business, both public organizations, and each certain person has to be engaged in all listed tasks.
Kazakhstan became the second in the list in size GDP per capita. In 2016 GDP has per capita made 7 453 dollars, or 2,55 million tenge (average annual dollar exchange rate - 334,5 tenge). Since 2013 this indicator was reduced, which speaks about negative tendencies in economy. The greatest reduction has been recorded in 2016 - 28,5 percent [5].
Kazakhstan was placed second on availability of housing and availability of loans. Coefficient of availability of housing are on a mark 13,23 and 0,50 on availability of loans.
Kazakhstan has taken the 10th place on inflation growth. Inflation in 2016 has made 8,5 percent.
8,5 million people have been engaged in economy of Kazakhstan in July of the current year, by assessment. Among the busy population the number of hired workers in the specified period was 6,3 million people. These are 74,3 % of total number occupied.
According to the second quarter of the current year the share of productively busy has made 86,4 % of the total number of independently busy population, unproductively busy — 13,6 %.
The number of the unemployed in July, 2017, by assessment, was 437 thousand people, unemployment rate — 4,9 %. Officially for the end of July, 2017 are registered in bodies of employment of 96,4 thousand people. The share of the registered unemployed has made 1,1 % of number of labor.
Level of the hidden unemployment for the second quarter 2017 was 0,3 % (23,9 thousand people) of number of labor.
The income of Kazakhstan citizens in the current year advances the speed of rise in price of life. In January-March of the current year the real income of Kazakhstan citizens has exceeded level the previous year for 2,4 %. At the same time, in comparison with February of this year in March the consumer ability of income of the population has improved for 4,8 % at once.
The situation with real income in the current year is much better, than it was last year. We will remind that last year the consumer ability of salaries and other receipts in the budget of the average Kazakhstan citizen was reduced with an average speed of 0,2 % a month. For 2016 real income in RK has dropped by 4,5 % - for the first time the last 7 years.
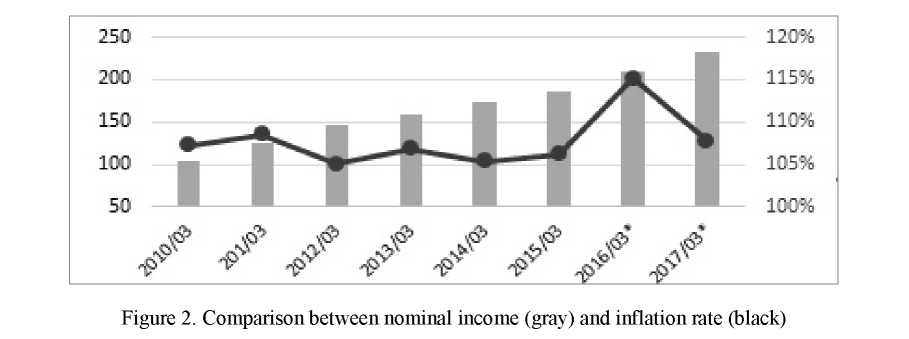
In the current year the income of Kazakhstan citizens managed to outstrip inflation in growth. Nominal monetary income for January-March, 2017 has made 232,1 thousand tenge, or is 10,4 % more, than was the previous year.
For the same period consumer prices of goods and services in RK have grown by 7,8 % - inflationary pressure this year much lower, than last year (Fig. 2).
Thus, the standard of living is restored to RK to a condition of 2013-2014 when the consumer activity grew in the country, and the business climate in economy was rather favorable [6].
Key indicators of the standard of living in RK, according to official statistical data, remain at the comfortable levels. In particular, the indicator of stratification of society in income (a ratio of income of 10 % of the least wealthy parts of the population which are most provided to 10 %) for the last 4 years doesn't exceed 5,6-5,7.
According to the recommendations of the UN, the indicator of coefficient of funds shouldn't exceed 810 - otherwise stratification in society increases that sharply increases risk of social explosions.
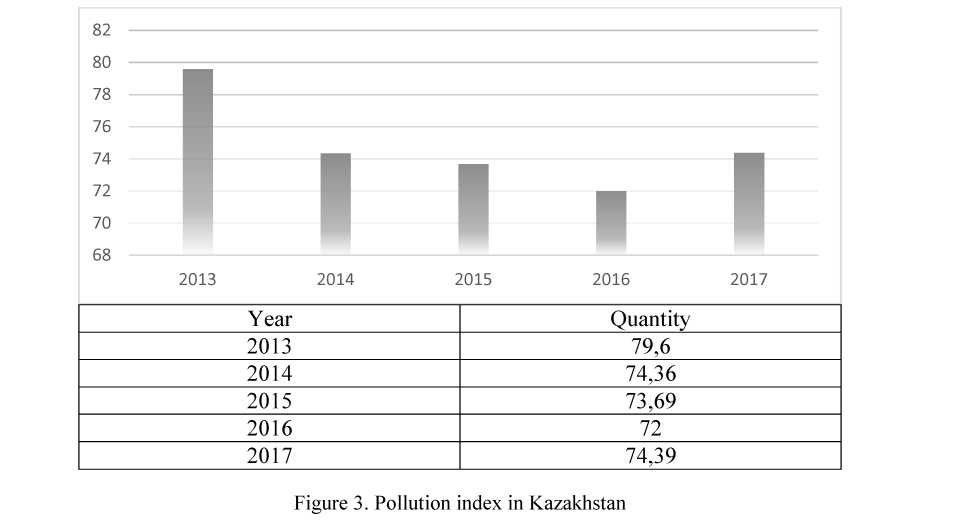
The biggest problem in growth of the standard of living in the Republic of Kazakhstan is the high level of pollution by waste. At the moment the country takes the 19th place in the world (according to Numbeo). Comparing to indicators of last year, the index of pollution has grown from 72.00 till 74.39, in 2016 Kazakhstan took the 32nd place (Fig. 3).
Turkmenistan is the third country in the list. GDP has per capita made 6 622 dollars. Indicators of 2014 - 8 191 dollars were the greatest value since 2011. The gain in five years has made 15,7 percent. Also in the country the biggest growth of an indicator (in percentage expression) in one year is noted. In 2012 GDP growth has per capita made 18,75 percent, or 1 073 dollars. Inflation in Turkmenistan has reached 6,17 percent.
Top four on GDP indicator Belarus with an indicator per capita closes 5 143 dollars. Average annual change in five years has made 3,1 percent. The most essential change of an indicator of GDP was per capita noted in 2015 - 2 652 dollars, or 28,6 percent.
Belarus has taken the eighth place in the rating of availability of housing and the last place in the rating of availability of loans. Availability of housing - 21,06, availability of loans - 0,14.
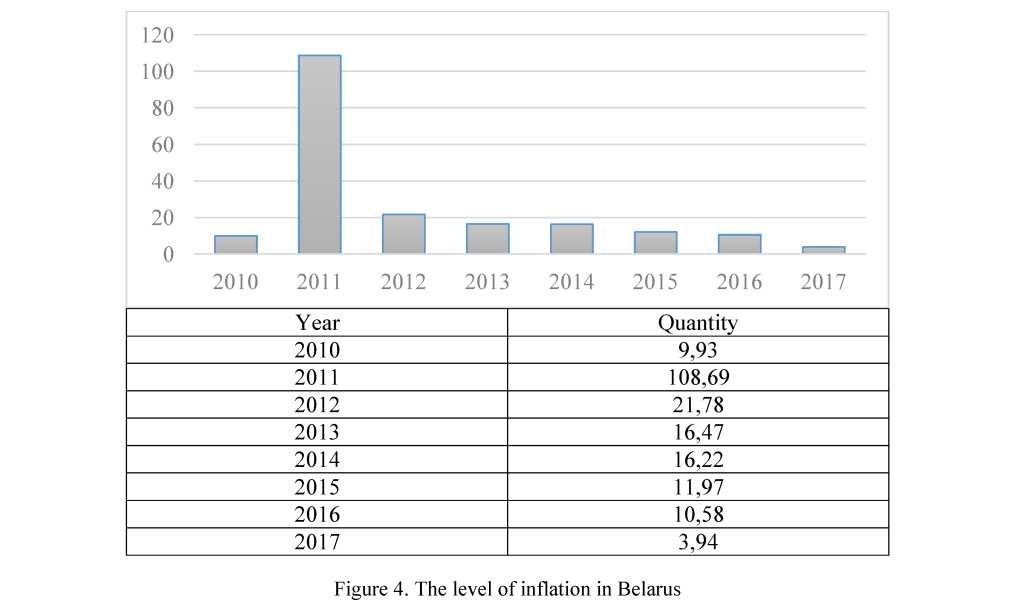
Also the country was included into top three with the highest inflation (Fig. 4). Inflation in the country has made 10,58 percent for 2016. Now, apart from November and December, the general rate of inflation is 3,94 %.
GDP indicators per capita in Azerbaijan, Georgia and Armenia fluctuate in the range from 3,5 thousand to 4 thousand. It is worth emphasizing, despite a small difference of values of an indicator, the countries have
different population. 9,49 million people live in Azerbaijan, in Georgia - 3,7 million and slightly less than three million people live in Armenia. Azerbaijan became the leader in deterioration in GDP per capita from 13 countries in five years. The indicator was reduced from 7 106 dollars in 2011 to 3 956 dollars in 2016 (-44,3 percent).
The coefficient of availability of housing in Azerbaijan has made 17,77 (the fifth place), coefficient of availability of loans - 0,47 (the fourth place). The country has caused a stir in the highest inflation (13,3 percent).
On availability of housing Georgia has been accommodated on the third place (16,32) and on the fifth place on availability of loans (0,44). Inflation in 2016 has reached a point 1,83 percent.
In Armenia the lowest increase in prices (-1,08 percent) is recorded. On availability of housing the country is in the sixth place, and on availability of loans - in the seventh.
Ukraine, Uzbekistan and Moldova have approximately identical indicator of GDP per capita. At the same time these countries have also essential differences. In percentage expression in five years Ukraine has lowered GDP indicator per capita by 38,9 percent, Uzbekistan has increased by 35,9 percent while in Moldova essential changes (-3,6 percent) weren't observed. One more significant difference is the population. In Ukraine 42,5 million people, live in Uzbekistan - 31,3 million, in Moldova - 3,55 million. In addition, Uzbekistan has the smallest volatility of an indicator from all selection of the countries in five years - 4,65 percent while volatility at Ukraine and Moldova exceeds 10 percent.
On the last place on availability of housing Ukraine (26,16), she on the penultimate place on availability of loans - 0,16 was placed. Inflation in the country has made 12,36 percent.
Uzbekistan shows average values. So, for example, the index of availability of housing is in the fourth place (16,35), the index of availability of loans on the eighth place, and inflation in the country is estimated at the level of 7,88 percent.
Moldova can be described as the country with the average performance. The country takes the seventh place in the rating of availability of housing, the sixth in the rating of availability of loans and the fifth on growth of price level. However, increase in prices level one of the best.
Closing the list of the countries are Kyrgyzstan and Tajikistan. GDP per capita in Kyrgyzstan makes 1 073 dollars, or 75 thousand som. The five-year maximum has been recorded in 2013 - 1 270 dollars. Tajikistan is the country with the smallest indicator of GDP per capita from the list, and in five years the difference has made (-36) dollars and has fallen up to 800 dollars in 2016.
Inflation in Kyrgyzstan was one of minimum and has made 0,49 percent while at Tajikistan inflation has reached 6,07 percent.
Tajikistan and Kyrgyzstan have no data on availability of housing and loans for acquisition of the real estate for 2016.
Proceeding from the analyzed indicators, it is possible to make the rating of the countries with optimum conditions for life. Four above described indicators with equal specific weight when calculating total value have been used for the rating (the maximum value - four).
The countries like Russiaand Kazakhstan were in the top two. Tajikistan (0,80) became the least attractive country from selection.
In the conclusion of this article it is to be said that these type of comparisons are the key for the development of our countries and without them we cannot visualize and see what the real problems are. While many aspects affect the standard of living, each country has its own infrastructure and has its own salvation for the development. This article gives the information about the weaknesses that the countries of the CIS region experience. Thus, the actions on it are different due to the diversity of the republics, but with the help of this work we know what directions to take for each country for the brighter future in terms of standard of living [7].
References
- Ganush, G.I., & Danil'chenko, A.V. (2015). Sotsialno-ekonomicheskaia model: stanovlenie i razvitie [Socio-economic model: formation and development]. Minsk: Belorusskaia navuka [in Russian].
- Kosov, Ju.V., & Toropygin, A.V. (2009). Sodruzhestvo Nezavisimykh Hosudarstv: Instituty, intehratsionnye protsessy, konflikty [Commonwealth of Independent States: Institutes, integration processes, conflicts]. Moscow: Aspekt Press [in Russian].
- Belorusskii natsionalnyi komitet statistiki [Belarusian National Statistics Committee]. belstat.gov.by. Retrieved from http://www.belstat.gov.by/ [in Russian].
- Federalnaia sluzhba hosudarstvennoi statistiki [Federal Service of State Statistics]. gks.ru. Retrieved from http://www.gks.ru/ [in Russian].
- Kazahstanskii natsionalnyi komitet statistiki [Kazakhstan National Statistics Committee]. Stat.gov.kz. Retrieved from Stat.gov.kz [in Russian].
- Samaia bolshaia internet-baza dannykh po urovniu prozhivaniia [The largest Internet database on the level of living]. Numbeo.com. Retrieved from Numbeo.com [in Russian].
- Husainova, Zh.S. Institutsionalnoe obespechenie industrialno-innovatsionnoho razvitiia hosudarstv - chlenov Evraziiskoho ekonomicheskoho soiuza [Institutional support of industrial-innovative development of the member states of the Eurasian Economic Union]. vestnik.ksu.kz. Retrieved from http://vestnik.ksu.kz/files_vestnik/Economy/Economy_3_87_2017.pdf [in Russian].