Since gaining independence in 1991 an issue of income inequality arised in the country. Sharp increase in income of people considered regional character of oil production boom. Author analyzed transition progress of Kazakhstani economy by drawing Lorenz curve and calculating Gini coefficient, as common methods of evaluating income inequality in economics. Also, author tested hypothesis of correlation between economic growth, increase in salaries and income inequality levels. After all calculations author concluded that country should closely monitor the expansion of oil field and oil-exploration. This has both direct and indirect effects on employment, inequality and overall growth of the economy in future. The government should be proactive in formulating macroeconomic policies, including tax reform, and creating trade opportunities beyond the hydrocarbon sector to improve income distribution. Investments in education in an active democratic environment will also further reduce income inequality. The current government's economic policy commonly known as «Nurly Zhol» emphasizes on economic growth, role of finance, industry and overall social welfare. Tighter control of national funds, increased economic diversification, investment in human capital, and continuing development of financial sector are some of the key areas needing close attention to reduce inequality in Kazakhstan in the foreseeable future. Formation of a developed market economy in Kazakhstan is possible only with a developed strategy, considering not only the past and present periods of its social development but also the future, which should be based on objective conditions and principles of functioning of transition economies. On a final note, the government should closely monitor the expansion of oil field and oilexploration. This has both direct and indirect effects on employment, inequality and overall growth of the economy in future.
Introduction
Economic development of society is inevitably associated with the transition of economic systems from one state to another. Economic systems change and arise because of the development of the economy and society. The transition from one economic system to another creates a special transition state of the economy, which can exist in one or several countries and even on a global scale [1].
In recent years, more than 80 countries have carried out fundamental reforms aimed at creating a market economy. All of them recognized the fundamental fact of economic life: prosperity and high living standards are impossible without the creation of a market economic system. Transition economies undergo a set of structural transformations intended to develop market-based institutions. These include economic liberalization, where prices are set by market forces rather than by a central planning organization. The process has been applied in China, the former Soviet Union and Eastern block countries of Europe and some Third world countries, and detailed work has been undertaken on its economic and social effects [1].
At the end of the 20th century a mass transition of many countries from a socialist to a market economy began, and, therefore, a group of issues arises in the fields of economics, which had never been faced before. It became necessary to comprehend and generalize new economic phenomena, to revise the doctrines and strategies of domestic and foreign policy.
Analysis of transition economies plays great methodological importance about their growing role in modern economic development. Time has shown that there are certain patterns of transitional processes in the economy and society. It is a new direction of economic science built on a fundamentally new methodological approach.
The study of transition processes is important for revealing the fundamental and purely specific for the transition period of macroeconomic development trends and opens great opportunities for new theoretical generalizations, solutions to many practical problems.
Main studies on transition economies compromise widely used indicators such as price liberalization, macro-economic stabilization, restructuring and privatization, legal and institutional reforms.
Recent studies of transition economies include researches in topics of equality of opportunity, gender equality and income equality. These imply modern indicators of successful completion of transition [2].
Kazakhstan's course through transition period is exceptional. Since the country gained independence in 1990, income inequality has been a main concern for Kazakhstan.
The development of major oil fields in Kazakhstan began in 1989, with oil itself being the major export product. The second half of the 1990s reversed the earlier economic situation through oil exports, prudent macroeconomic policies by government, hard budget constraints on enterprises and the banking sector, the removal of trade distortions, and with liberalized pricing policies. Various economic reforms have resulted in unprecedented average growth rates of 6 % per annum between 1996 and 2013 [1]. The population below the poverty line has declined significantly. However, high levels of income inequality remain visible in rural areas [3; 4].Various policies such as cash transfer to migrants, tax on real estates, and price subsidies to the rural poor are being introduced to combat in reducing regional inequalities.
The time and practical difficulty of implementing privatization and stabilization measures have forced governments to liberalize first and only then to undertake stabilization and privatization initiatives. The improper sequencing of reforms is likely to have a significant impact on the stability of the transition to a market economy [5].
January 6, Kazakhstan issued a decree on the liberalization of prices — the state released the cost of almost all goods in free navigation. The step was important from the point of view of transition to a market economy, however, it caused a general price increase and chronic inflation. The annual inflation in 1992 exceeded 3000 % [6].
The liberalization of the economy on the principle of «shock therapy» was objectively the only correct direction for Kazakhstan, which after the collapse of the USSR did not have the possibility of a phased transfer of society to new business conditions, since it was completely dependent on the course of reforms in Russia (6). In 1993, the Program of Urgent Anti-Crisis Measures and Deepening of Social and Economic Reforms was adopted.
Through auctions and competitions during 1991–1992, 4770 objects were privatized, including 472 state farms transferred to collective ownership. Objects of retail trade, catering, consumer services, communal services accounted for 60 % of the total number of privatized enterprises [7].
In total, during the period 1991–2005, 39853 state-owned property was privatized, including 3709 state- owned blocks of shares in joint-stock companies and 36050 property complexes, real estate, unfinished construction and other facilities. The revenues from privatization for all these years totaled 334 billion 216 million tenges, including 68 billion 54 million tenges transferred to the National Fund of the Republic of Kazakhstan [7].
Transition Report published by EBRD in 2016 was the first one to deal exclusively with the important subject of inequality and economic inclusion. It focuses on several key aspects of inclusive growth: the distribution of income; the impact that the transition process has had on people's well-being and happiness; equality of opportunity; and financial inclusion. The analysis in this report draws on the third round of the Life in Transition Survey, a household survey conducted by the EBRD and the World Bank in 34 countries in late 2015 and the first half of 2016 [2].
In many foreign studies of new data, scientists concluded that Kuznets's hypothesis should rather be rejected: economic growth may be accompanied by a decrease, an increase or a conservation of inequality. Researchers note examples when the increase in inequality took place against a backdrop of not growth but a decline (the countries of Eastern Europe and Central Asia in the period 1985-1995, [8], as well as examples of the negative impact of inequality on economic growth.
Research question. Determine current stage of transition process of Kazakhstan by evaluating income inequality.
Research hypothesis. Positive correlation between economic growth and income equality in transition economies is constructed. Income inequality decreases linearly with economic growth in a long-run transitioning country.
Research objective. The purpose of the dissertation work is to study the essence of the transition processes of the economic system of modern Kazakhstan and evaluate income inequality by regions.
The following tasks serve to achieve these goals:
- to identify general theoretical approaches to the study of the transition processes of the economic system;
- based on the analysis of the main global transition indicators look through the historical path of Kazakhstani economy;
- to identify the current progress of transition process by calculating Gini coefficient and Lorenz curve;
- to propose and justify practical recommendations on the formation of economic and institutional policies for the withdrawal of the economy of Kazakhstan to the trajectory of sustainable development.
The scientific importance of the study is determined by the following:
- given an analysis of current results of market transformations are given;
- analyzed main transition indicators in a prospect of Kazakhstani economic path;
- estimated correlation between income inequality, economic growth and average salary; performed regression analysis;
- recommendations on the formation of economic and institutional policies of the state in the conditions of transition to a new model of management;
- methodological recommendations proposed by the author can serve as a basis for improving the activities of regional government bodies.
The practical significance of the work is that the results obtained during the analysis of transition processes can serve as a basis for the creation of a general theory of transition processes in Kazakhstan. Identified current level of progress by using modern statistical approach. The proposed recommendations in the field of formation of economic and institutional policies can be used during further reforming the Kazakhstani economic system.
Methodology
In this section, the number of methodological approaches in the fields of income inequality was described. First, as primary and common indicators of income inequality, represented Lorenz curve and Gini coefficient calculation methods. Secondly, there was constructed regression model regarding the hypothesis discussion above. Constrained sensitivity analysis between GDP per capita values and average salary as an economic growth indicators and income inequality level. Data from official statistical sources is used.
1. Lorenz curve
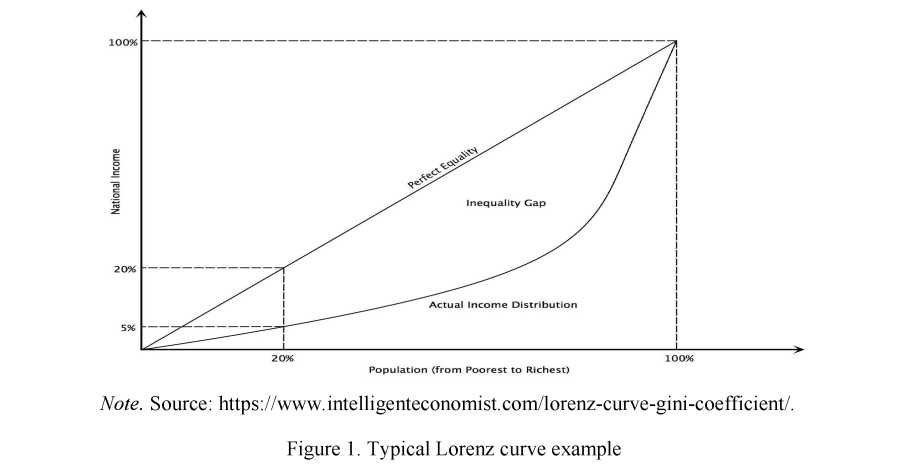
The Lorenz curve is a graphical representation of income inequality or wealth inequality developed by American economist Max Lorenz in 1905. The graph plots percentiles of the population based on income or wealth on the horizontal axis. The Lorenz curve is often accompanied by a straight diagonal line with a slope of 1, which represents perfect equality in income or wealth distribution; the Lorenz curve lies beneath it, showing the actual distribution. The area between the straight line and the curved line, expressed as a ratio of the area under the straight line, is the Gini coefficient, a measurement of inequality.
The Lorenz curve can usually be represented by a function L(F), where F, the cumulative portion of the population, is represented by the horizontal axis, and L, the cumulative portion of the total wealth or income, is represented by the vertical axis:
Y = L(X).
Please refer to Figure 1 to typical Lorenz curve example.
A Lorenz curve always starts at (0,0) and ends at (1,1). The Lorenz curve is not defined if the mean of the probability distribution is zero or infinite.
The Lorenz curve for a probability distribution is a continuous function. However, Lorenz curves representing discontinuous functions can be constructed as the limit of Lorenz curves of probability distributions, the line of perfect inequality being an example.
The information in a Lorenz curve may be summarized by the Gini coefficient. The Lorenz curve cannot rise above the line of perfect equality. If the variable being measured cannot take negative values, the Lorenz curve:
- cannot sink below the line of perfect inequality;
- is increasing.
To draw Lorenz curve there were used official statistical data of labor force and average salary by regions as at first quarter of 2018. Please refer to Table 1 to see primary data used.
Table 1 Average salaries and labor force at the first quarter of 2018
Note. Source: constructed by author.
|
№ |
Region |
Labor force |
Labor force, % |
Cumulative, % |
Average salary, KZT |
Average salary, % |
Cumulative, % |
|
ɪ |
South Kazakhstan |
1,197,038 |
13 % |
13 % |
102,080 |
4 % |
4 % |
|
2 |
Almaty region |
1,037,531 |
11 % |
25 % |
108,727 |
5 % |
9 % |
|
3 |
Almaty city |
939,190 |
10 % |
35 % |
187,791 |
8 % |
17 % |
|
4 |
East Kazakhstan |
722,286 |
8 % |
43 % |
126,594 |
5 % |
22 % |
|
5 |
Karagandy |
685,000 |
8 % |
51 % |
142,052 |
6 % |
28 % |
|
6 |
Zhambyl |
531,067 |
6 % |
57 % |
102,134 |
4 % |
32 % |
|
7 |
Astana city |
521,492 |
6 % |
62 % |
223,533 |
9 % |
41 % |
|
8 |
Kostanay |
517,098 |
6 % |
68 % |
114,836 |
5 % |
46 % |
|
9 |
Aktobe |
429,464 |
5 % |
73 % |
125,915 |
5 % |
51 % |
|
10 |
Akmola |
428,878 |
5 % |
78 % |
110,395 |
5 % |
56 % |
|
11 |
Pavlodar |
416,311 |
5 % |
82 % |
133,905 |
6 % |
61 % |
|
12 |
Kyzylorda |
347,411 |
4 % |
86 % |
122,022 |
5 % |
66 % |
|
13 |
West Kazakhstan |
336,605 |
4 % |
90 % |
145,999 |
6 % |
72 % |
|
14 |
Atyrau |
315,711 |
3 % |
93 % |
279,850 |
12 % |
84 % |
|
15 |
North Kazakhstan |
310,312 |
3 % |
97 % |
102,254 |
4 % |
88 % |
|
16 |
Mangystau |
292,038 |
3 % |
100 % |
282,009 |
12 % |
100 % |
|
9,027,432 |
100 % |
2,410,096 |
100 % |
2. Gini coefficient
The Gini coefficient is a measure of inequality of a distribution. It is defined as a ratio with values between 0 and 1: the numerator is the area between the Lorenz curve of the distribution and the uniform distribution line; the denominator is the area under the uniform distribution line. It was developed by the Italian statistician Corrado Gini and published in his 1912 paper "Variabilita e mutabilita» («Variability and Muta- bility»). The Gini index is the Gini coefficient expressed as a percentage, and is equal to the Gini coefficient multiplied by 100 (the Gini coefficient is equal to half of the relative mean difference).
The Gini coefficient is often used to measure income inequality. Here, 0 corresponds to perfect income equality (i.e. everyone has the same income) and 1 corresponds to perfect income inequality (i.e. one person has all the income, while everyone else has zero income).
The Gini coefficient is defined as a ratio of the areas on the Lorenz curve diagram. If the area between the line of perfect equality and Lorenz curve is A, and the area under the Lorenz curve is B, then the Gini coefficient is A∕(A+B). Since A+B = 0.5, the Gini coefficient, G = 2A = 1-2B. If the Lorenz curve is represented by the function Y = L(X), the value of B can be found with integration and:

3. Hypothesis testing, measurement and variables
In this part of section examined the link between economic growth and income inequality level. Constructed general function is following:
Whereas, IEt is income inequality, Yt is GDP per capita and Wt is average salary since 1996 to 2015. Please refer to Table 2 for input variables used during the regression testing. During the testing used Gini index calculated by World bank since 1996.
Table 2 Gini index (World bank), GDP per capita and average salary
Note. Source: constructed by author.
|
Year |
Gini index |
GDP per capita, KZT |
Average salary, KZT |
|
1996 |
35.4 |
90,880 |
6,841 |
|
2001 |
35.4 |
218,772 |
17,303 |
|
2002 |
34 |
254,142 |
20,323 |
|
2003 |
33 |
309,341 |
23,128 |
|
2004 |
31.4 |
391,004 |
28,329 |
|
2005 |
29.6 |
501,128 |
34,060 |
|
2006 |
30 |
667,212 |
40,790 |
|
2007 |
28.5 |
829,865 |
52,479 |
|
2008 |
29.1 |
1,024,175 |
60,805 |
|
2009 |
28.8 |
1,056,855 |
67,333 |
|
2010 |
28.6 |
1,336,606 |
77,611 |
|
2011 |
27.4 |
1,705,849 |
90,028 |
|
2012 |
27.5 |
1,847,085 |
101,263 |
|
2013 |
26.3 |
2,113,205 |
109,141 |
|
2014 |
26.5 |
2,294,830 |
121,021 |
|
2015 |
26.5 |
2,330,360 |
126,021 |
Above hypothesis is tested using descriptive statistics and regression analysis.
Results of described methods discussed in next section.
3. Results
In this study inequality was calculated for Kazakhstani citizens monthly average salary by using Lorenz curve and Gini coefficients. Also, hypothesis of positive correlation between economic growth in early stages and income inequality is tested.
Lorenz curve results are seen from Figure 2. A popular measure of inequality is the Gini coefficient, derived from the Lorenz curve, which ranges from 0 (perfect equality) to 1 (perfect inequality or one has all the income; all others have none). The figure shows the existence of skewed distribution. The Lorenz curve is far from the equality distribution line. Gin-coefficient value of 0.17 also guarantees the existence of inequality in average salaries holding distribution among citizens in the area.

The biggest disruption has given by South Kazakhstan and Mangystau regions, where 13 % of labor force population earn 4 % of total income and 3 % of labor force population earn 12 % of total income, accordingly. It is explained by historical and economical differentiations of regions: Mangystau region is oil and gas producing GDP propel, whereas South Kazakhstan is more agriculture-orienteded. Economic growth has not been inclusive as new jobs are limited almost exclusively to the oil sector. There is therefore a significant need to develop the labour market through private sector investment outside the oil sector.
Overall, coefficient of income earnings by labor force is explainable by economic factors. Kazakhstani economy mainly based on raw materials exploration and supply, which effect average salaries in regions and clearly visible in results of the calculation.
Figure 3 summarized the results of hypothesis testing.
During the testing used time period of 20 years (1996–2015), which is considered to be long-run. Based on calculations, correlation between Gini index and GDP per capita is -0.89, whereas correlation between Gini index and average salary -0.90 (Table 3). It accepts hypothesis of positive correlation between income equality and economic growth in the long-run. Income inequality is closely correlated with economic growth, and the connection has a negative sign, that is, an improvement in this ratio (a decrease in the adjusted coefficient) is accompanied by economic growth. For the summary statistics results, please refer to Table 4 and for hypothesis testing summary for all variables, please refer to Table 5.


Table 3
Correlation matrix
Note. Source: constructed by author.
|
Variable |
Gini index |
GDP per capita |
Average salary |
|
Gini index |
1 |
-0.891 |
-0.907 |
|
GDP per capita |
-0.891 |
1 |
0.997 |
|
Average salary |
-0.907 |
0.997 |
1 |
To decrease income inequality between the rich and poor, the financial sector in Kazakhstan should be socially inclusive over time, leading to benefits for all segments of society. The development of capital markets and greater access to the same is necessary in this respect. The relocation of resources beyond the oil sector, technological innovation and accumulation of human capital are also required to lift the poor and middle class. Suggestion is made that the economy should also diversify its industrial base beyond the oil sector to improve income distribution and job opportunities.
4. Conclusion
The model of transformation of Kazakhstani economic system should be based on an effective combination of the needs of modern economic development and clear determination of the government role. There are certain areas of macroeconomic management, where actions initiated by the state should be the norm.

The state should create reliable legal and social market conditions for the realization of economic goals, while at the same time there are vast areas of institutional transformation where state intervention is unacceptable.
Although the process of reform has been going on since the beginning of the 1990s, and to this day there is no clear model of the economy and society that would be desirable for most the population of the country and at the same time achievable. There are no targets in the sphere of economic policy. To act as a regulating factor in socio-economic life, it is necessary to radically change its functions in relation to the conditions and requirements of a market economy. It must be able to pursue a policy of compensation for the social costs that accompany reforms. Reforming Kazakhstan involves the development of a clear concept of a well-conceived and interrelated transformation plan.
The government should be proactive in formulating macroeconomic policies, including tax reform, and creating trade opportunities beyond the hydrocarbon sector to improve income distribution. Investments in education in an active democratic environment will also further reduce income inequality. The current government's economic policy commonly known as «Nurly Zhol» emphasizes on economic growth, role of finance, industry and overall social welfare. Tighter control of national funds, increased economic diversification, investment in human capital, and continuing development of financial sector are some of the key areas needing close attention to reduce inequality in Kazakhstan in the foreseeable future.
Formation of a developed market economy in Kazakhstan is possible only with a developed strategy, considering not only the past and present periods of its social development but also the future, which should be based on objective conditions and principles of functioning of transition economies.
On a final note, the government should closely monitor the expansion of oil field and oil-exploration. This has both direct and indirect effects on employment, inequality and overall growth of the economy in future.
References
- International Monetary Fund (IMF 2014). www.imf.org. Retrieved from http://www.imf.org/extemal/country/KAZ/
- EBRD Transition report 2016–17 (2016). Transition for all: equal opportunities in unequal world. www.ebrd.com. Retrieved from www.ebrd.com.
- Agarwal, P. (2007). Economic growth and poverty reduction: Evidence from Kazakhstan. Asian Development Review, 24(2): 90–115.
- Central Intelligence Agency (CIA) (2010) The World Factbook (Kazakhstan). www.theodora.com. Retrieved from http://www.theodora.com/wfbcurrent/kazakhstan/kazakhstan_economy.html
- Feige Edgar, L. (1994). The transition to a market economy in Russia: property rights, mass privatization and stabilization. Routledge, 57–58.
- KazPravda. (2016) The first difficult year. kazpravda.kz. Retrieved from http://www.kazpravda.kz/news/25-let- nezavisimosti-rk/samii-pervii-trudnii-god/.
- Strategy 2050. (2015). Pravitization in Kazakhstan. strategy2050.kz. Retrieved from strategy2050.kz.
- Adams, R. (2003). Economic growth, inequality, and poverty — findings from a new data set. World Bank Policy Research Working Paper, No. 2972. Washington, D.C.