The ecological state of water bodies is formed as a result of the interaction of factors of self-purification. Anthropogenic load and is determined mainly by stationary and field studies. An actual task is to systematize theoretical and methodological approaches to the use of geo information technologies in the process of environmental research and the cartographic presentation of their results. The article discusses and analyzes the data of Kazhydromet for the period from 2008 to 2018, and assesses the quality of water by complete of hydro chemical indicators of four points. Chart diagrams were built on the analyzing data, priority substances and enterprises that make the greatest contribution to the pollution of the reservoir and river are identified.
Introduction
Indicators of the ecological state of water bodies include a significant number of hydro chemical and hydro biological characteristics. There are the numbers of water classifications by combining numerous physical, hydro chemical and biological characteristics. The possibilities of using complex classifications for cartographic purposes are in significant due to the high cost and laboriousness of relevant studies and, as a result, small number of definition points. For mapping purposes, the simplest indicators are needed, defined in as many points as possible and providing the ability to compare different water bodies. As such indicator, the most commonly used index of water pollution (WPI) [1].
The monitoring of surface water pollution is carried out using stationary posts. Water pollution, as well as atmospheric pollution, is a complex, multifactorial and highly dynamic process. The concentrations of various pollutants present in the aquatic environment are characterized by complex temporal dynamics and depending on the intensity of entry into water bodies, the rate of self-cleaning and sedimentation processes, the volume of the water mass, the nature and speed of its movement. Each of the listed pollution factors is relatively independent of the others and has its dynamics. Pollutant center water bodies with sewage from industrial and agricultural enterprises, public utilities, with surface run off due to flushing from contaminated areas, during precipitation from the atmosphere, from secondary chemical processes of the transformation of pollutants, from natural sources. Waste water volumes are determined by the process of their formation and accumulation in enterprises and everyday life. A feature of the pollution of water bodies is the sharp variability associated with the possibility of volley discharges from storage tanks, both technologically determined and emergency. Flushing from contaminated areas is also extremely uneven in time and occurs during rain water and melt water run-off, as well as during floods. Precipitation from the atmosphere is determined by the presence of precipitated (leaching) impurities in it and the presence of appropriate meteorological conditions. Precipitation from the atmosphere is determined by the presence of precipitated (leaching) impurities in it and the presence of appropriate meteorological conditions [2].
One of the major artificial reservoirs in the Central Kazakhstan is the Samarkand. Its construction began in 1934 and ended in 1940. Significant volumes of water from the Samarkand reservoir are used for their activities by the Arcelor Mittal Temirtau Metallurgical Plant JSC, Bassel Group LLP, Temirtau Electrometallurgical Plant JSC, Aktau Cement Plant, Aktau village, take water for irrigation horticultural partnerships. Located on the Nura river, the Samarkand reservoir is the center of large enterprises in the chemical, metallurgical and coal industries, which are distinguished by high water consumption and there lease of waste into the environment. In the river basin, Nura has many environmental issues. With the development of industry in the 20th century, water intake for industrial needs and the discharge of industrial waste into rivers began in the basin. Because of this, now the Nura river and its tributaries are contaminated with mercury compounds and oil products [3].
It should be noted that the quality of surface waters is determined by hydrochemical and hydrobiological indicators. Similar studies in the Central Kazakhstan will be used to analyze the state of surface waters of the Nura River basin. These studies are carried out by a branch of RSE Kazhydromet for the Department of Environmental Monitoring.
Now GIS technology is the main method of aggregation and visualization of geospatial data, as well as the technical basis of thematic maps based on them. Since data on environmental pollution are often very voluminous (for example, the results of long-term results of environmental monitoring) their analysis and mapping without the use of technical means of data bases and geodata banks and GIS are difficult. Environmental pollution is usually defined as the introduction into the environment or the appearance in it of characteristic physical, chemical or biological agents, or as an excess of the natural long-term average concentration of agents in the period under consideration.
An urgent task is the systematization of theoretical and methodological approaches to the use of geographic information technologies in the process of environmental research and the cartographic presentation of their results. The article presents a solution to this scientific problem. The purpose of environmental mapping is to analyze the environmental situation and its dynamics, i.e. identification of spatial and temporal variability of environmental factors affecting human health and the state of ecosystems. To achieve this goal, it is necessary to collect, analyze, evaluate, integrate, territorial interpretation and create a geographically correct cartographic representation of a very diverse, often difficult to compare environmental information [4]. The largest negative impact on the condition and quality of water in the Nura River is exerted by the combined waste water discharge channel of Arcelor Mittal Temirtau JSC and the Сhemical and Metallurgical plant Temirtau Electro-Metallurgical Plant LLP. The main pollutants in this section of the river are nitrite nitrogen, copper, zinc, phenol, sulfates and petroleum products, several times higher than the maximum permissible concentrations. The purpose of the study was to identify the dynamics of changes in the water quality of the Samarkand reservoir and the Nura River in the period from 2008 to 2018.
Research and methodology
The initial information for mapping was data on the total emissions of pollutants into the water from stationary sources, the number of these sources for 2008–2018, according to the data of the State Hydrometeorological Service Kazhydromet. Based on this information, ananalysis was made of the state of the surface water of the Samarkand reservoir and the Nura river of the Central Kazakhstan and map diagrams of data for 2008 to 2018 from 4 posts were compiled:
- Samarkand reservoir, 7 km above the dam of Temirtau (Karaganda);
- Samarkand reservoir, 0.5 km along the alignment from the southern coast of the river. Within the city of Temirtau (Karaganda);
- Nura River, 1 km above the combined waste water discharge of Arcelor Mittal Temirtau JSC and the Сhemical and Metallurgical plant Temirtau Electro-Metallurgical Plant LLP, Temirtau (Karaganda);
4. Nura River, 1 km above the combined waste water discharge of Arcelor Mittal Temirtau JSC and the Сhemical and Metallurgical plant Temirtau Electro-Metallurgical Plant LLP Temirtau (Karaganda) [5].
One of the most advanced mapping programs at the moment is Arc GIS, along with it, SAS. Planet is used to obtain satellite images with reference to the coordinate system. Using the SAS Planet program, you can create high-quality foundation for a future map; using the Arc GIS software modules, the map itself is created. Data on pollutants were placed in the database. This GIS has ample opportunities for working with internal and external databases, and in particular, it implements the standard Pyton language. Python extends to the entire Arc GIS system, turning into a language for analysis, data transformation, automation of cartographic processes and allows to increase the productivity of these works.
To work with spatial data, the Arc GIS10.1 software package was used. To obtain satellite images in conjunction with the coordinate system, the SAS. Planet program was used.
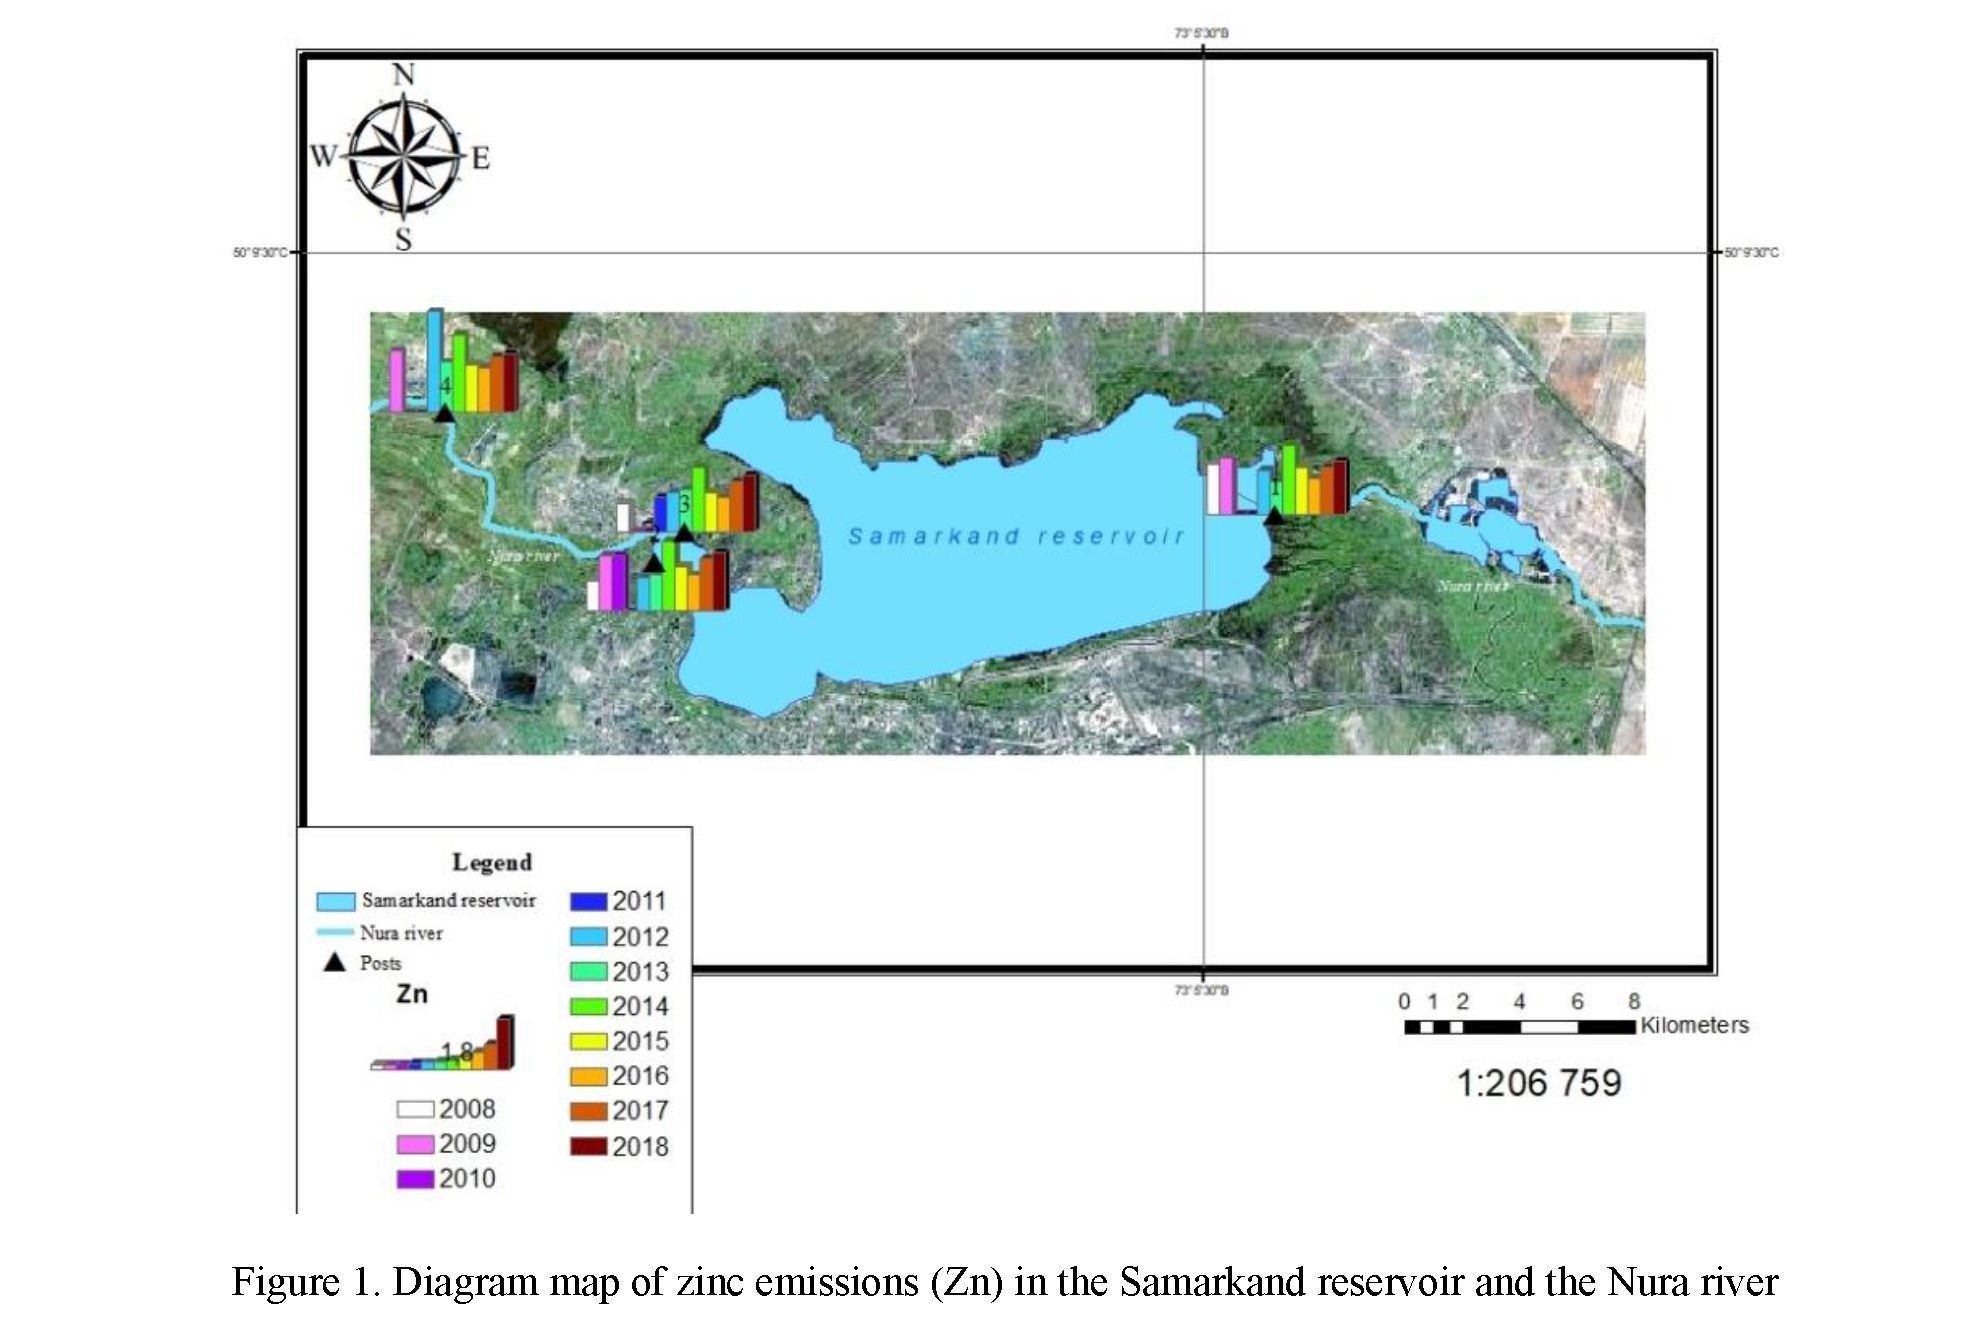
To determine the assessment of the temporary state of water in the Nura River and the Samarkand reservoir, one of the methods for assessing the quality of water bodies using a complex of hydrochemical indicators is used-the hydrochemical index of water pollution (Fig. 1). This index represents the average proportion of excess TLV for a strictly limited number of limited ingredients [6].
55
Research results and discussion
Cartographic diagrams were compiled on the dynamics of pollution of individual elements. According to the data analysis of the RSE “Kazhydromet” in the upper part of the object, the zinc content varies from 0.012 mg/dm3 (2013) to 0.025 mg/dm3 (2014) (Fig. 1), the average level is 0.0174. It exceeds the MPC by 1.7 times. Over the entire period under observation, the level of pollution increases from 1-point to 4-point. This is due to the number of industrial facilities using water is increasing. The pollution concentration decreased in 2013 to an average of 0.014 mg/dm3, but by 2014 it increased to 0.025 mg/dm3. The zinc concentration at the 4-point exceeds the annual average of the previous points, their difference is 0.01 mg/dm3. At the same time, the sequential cumulative increase in the concentration of zinc during movement downs tream the Nura River is also preserved. For example, the indicators of the four points under consideration were as follows: 0.019–0.021–0.020–0.024 mg/dm3.
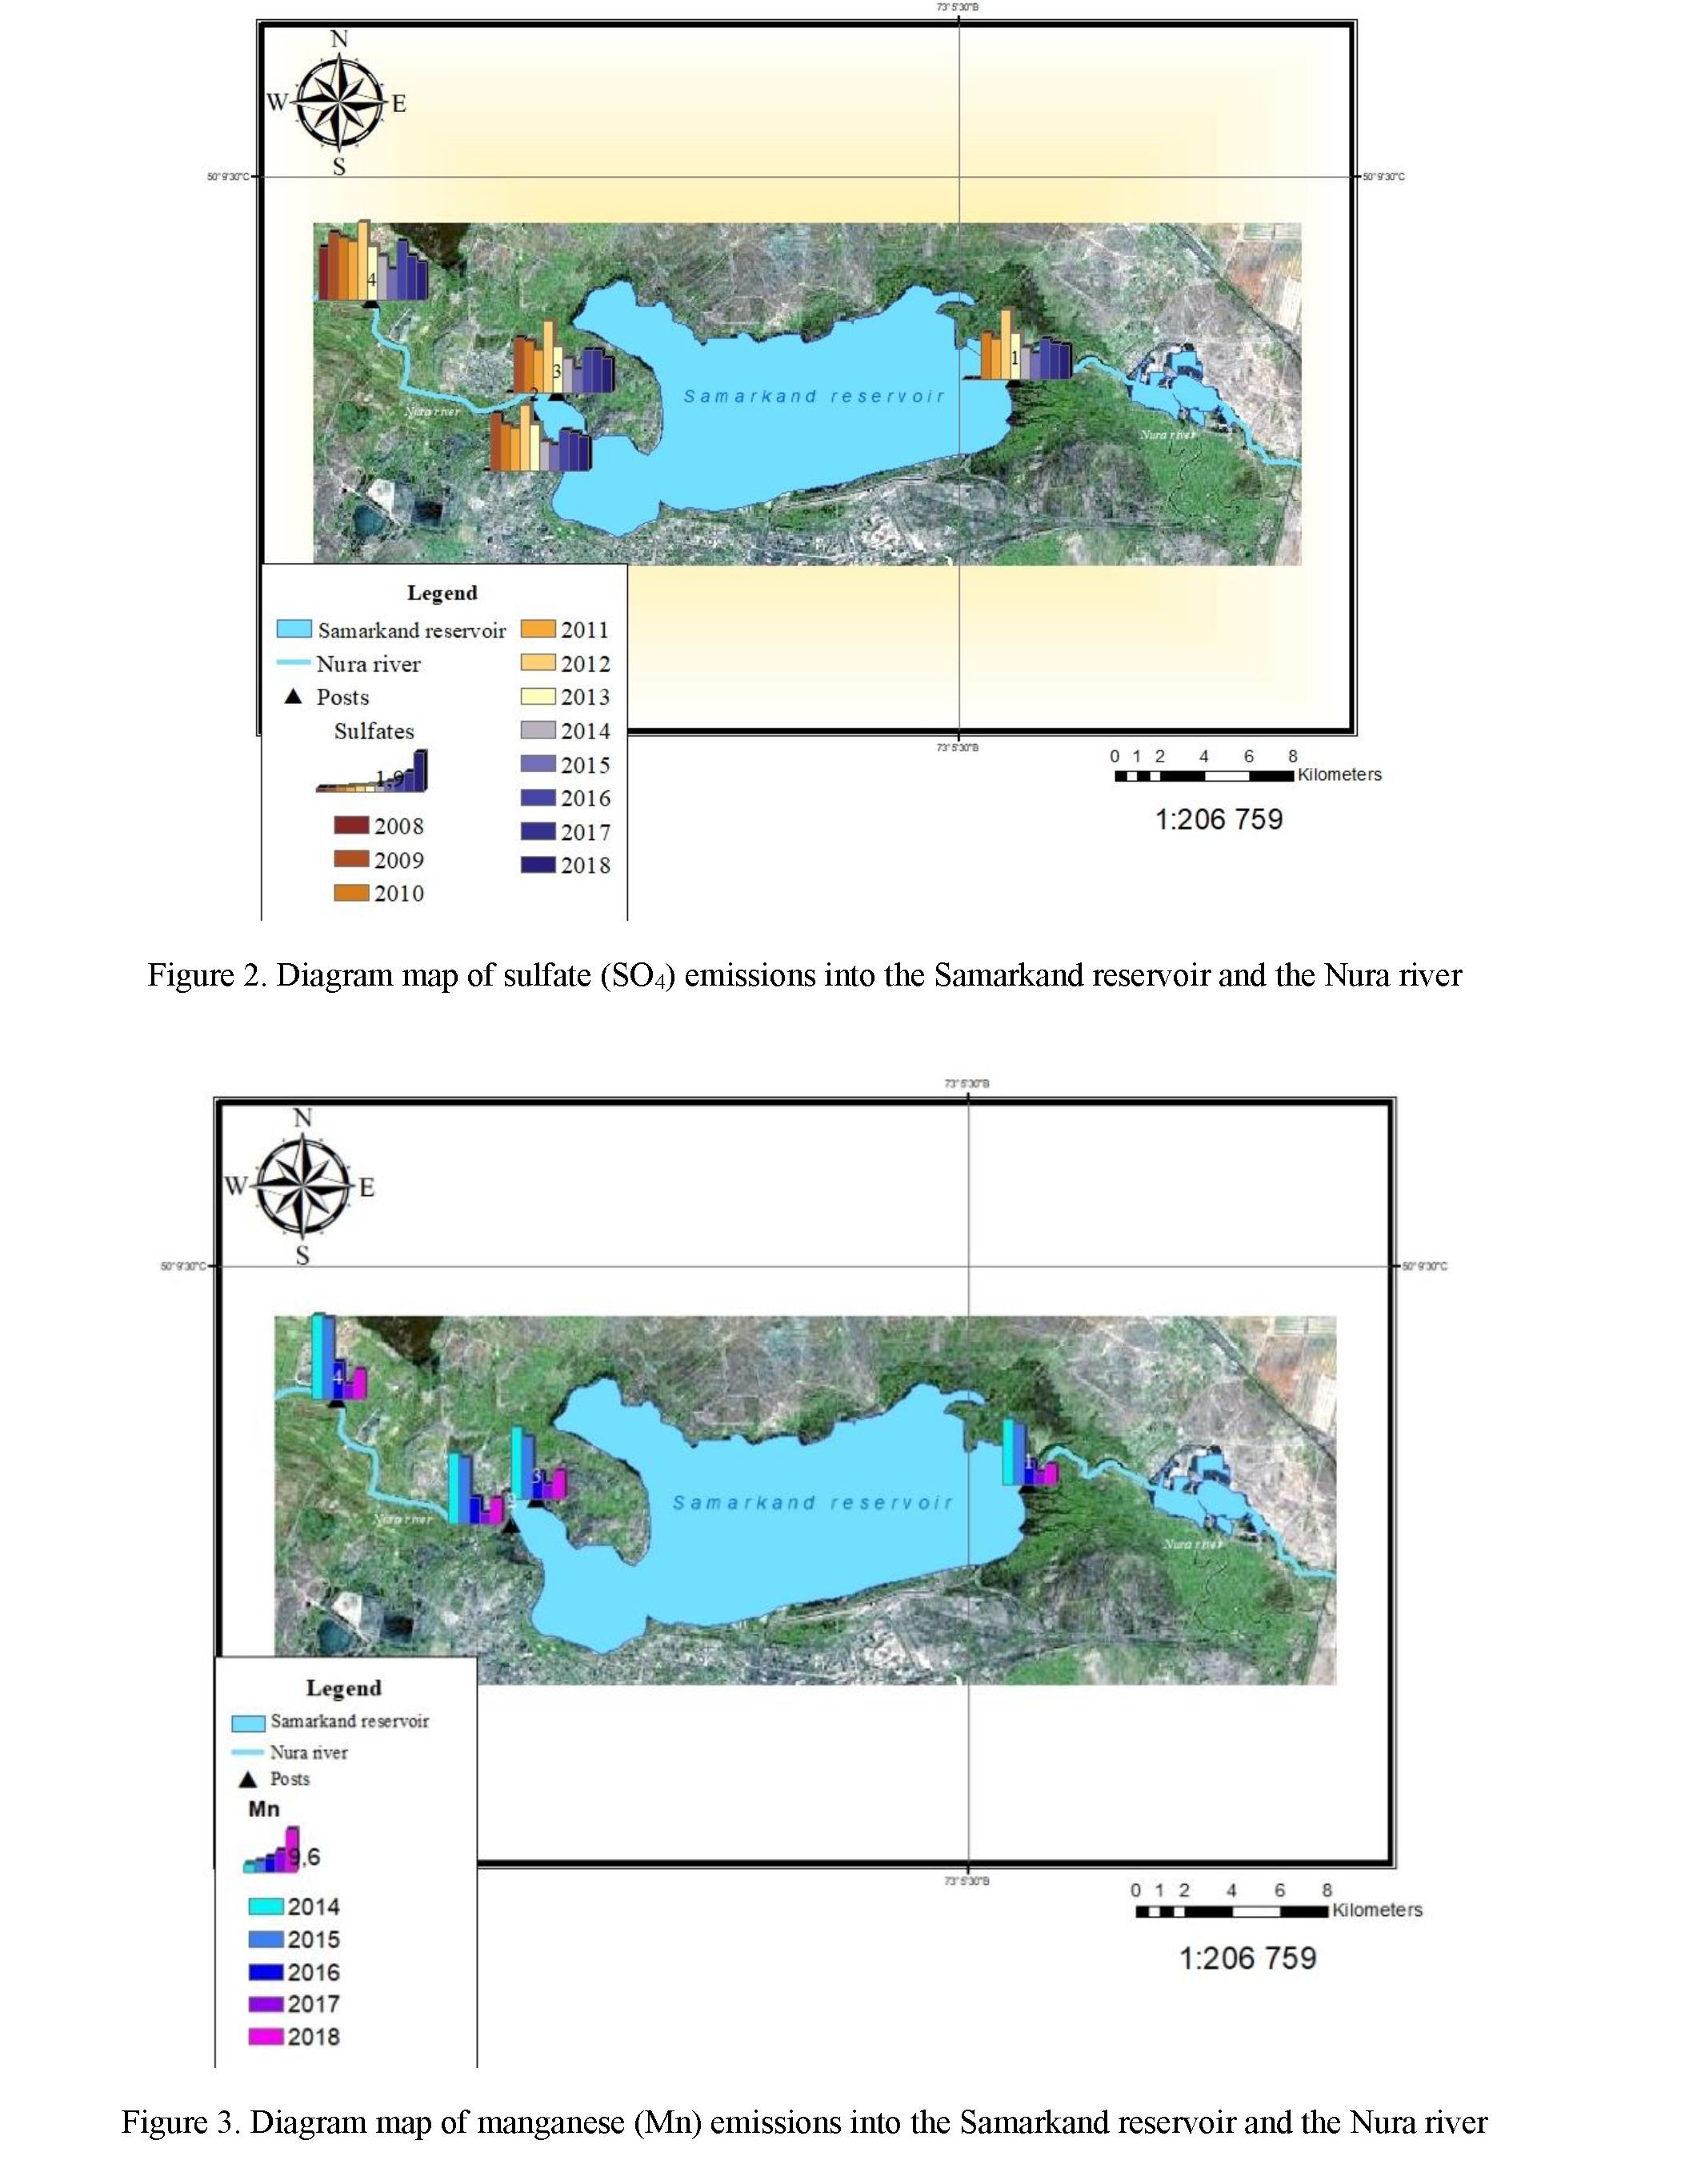
The analysis of sulfate pollution data (Fig. 2) shows that since 2008, from 248 mg/dm3 by 2018, it has decreased to 183 mg/dm3 (1.8TLV). Against this background, a single excess of concentration in 2012 to 367 mg/dm3 stands out, which amount to 3.6 TLV.
For the observation period under consideration, data are available from 2014 to 2018, the level of manganese pollution (Fig. 3) decreased at 1 point to 0.148 at 0.046, 2 points from 0.16 to 0.055, 3 points 0.162 to 0.62 and 4 points from 0.191 to 0.021 which is an average of 28.6 %.
The analysis of copper pollution (Fig. 4) shows a down ward trend at the first point: the average copper concentration decreased from 0.0031 in 2008 to 0.0019 in 2018; at the second point, there were no changes in the same period; at the third point, they changed from 0.0024 to 0.0025; at the fourth point, there is also a decrease from 0.0031 to 0.0024. As with other polluting agents, there is a gradual increase in concentration from 2012 to 2014.
The next chart diagram (Fig. 5) shows that the waters of the Samarkand reservoir and the Nura river above the sewage discharge channel throughout the entire period belong to the third class of water quality, that is, to “moderately polluted”. Water in the waste water discharge area has long belonged to the fourth quality class, but in recent years water quality has improved.
Серия «Биология. Медицина. География». № 2(98)/2020
57
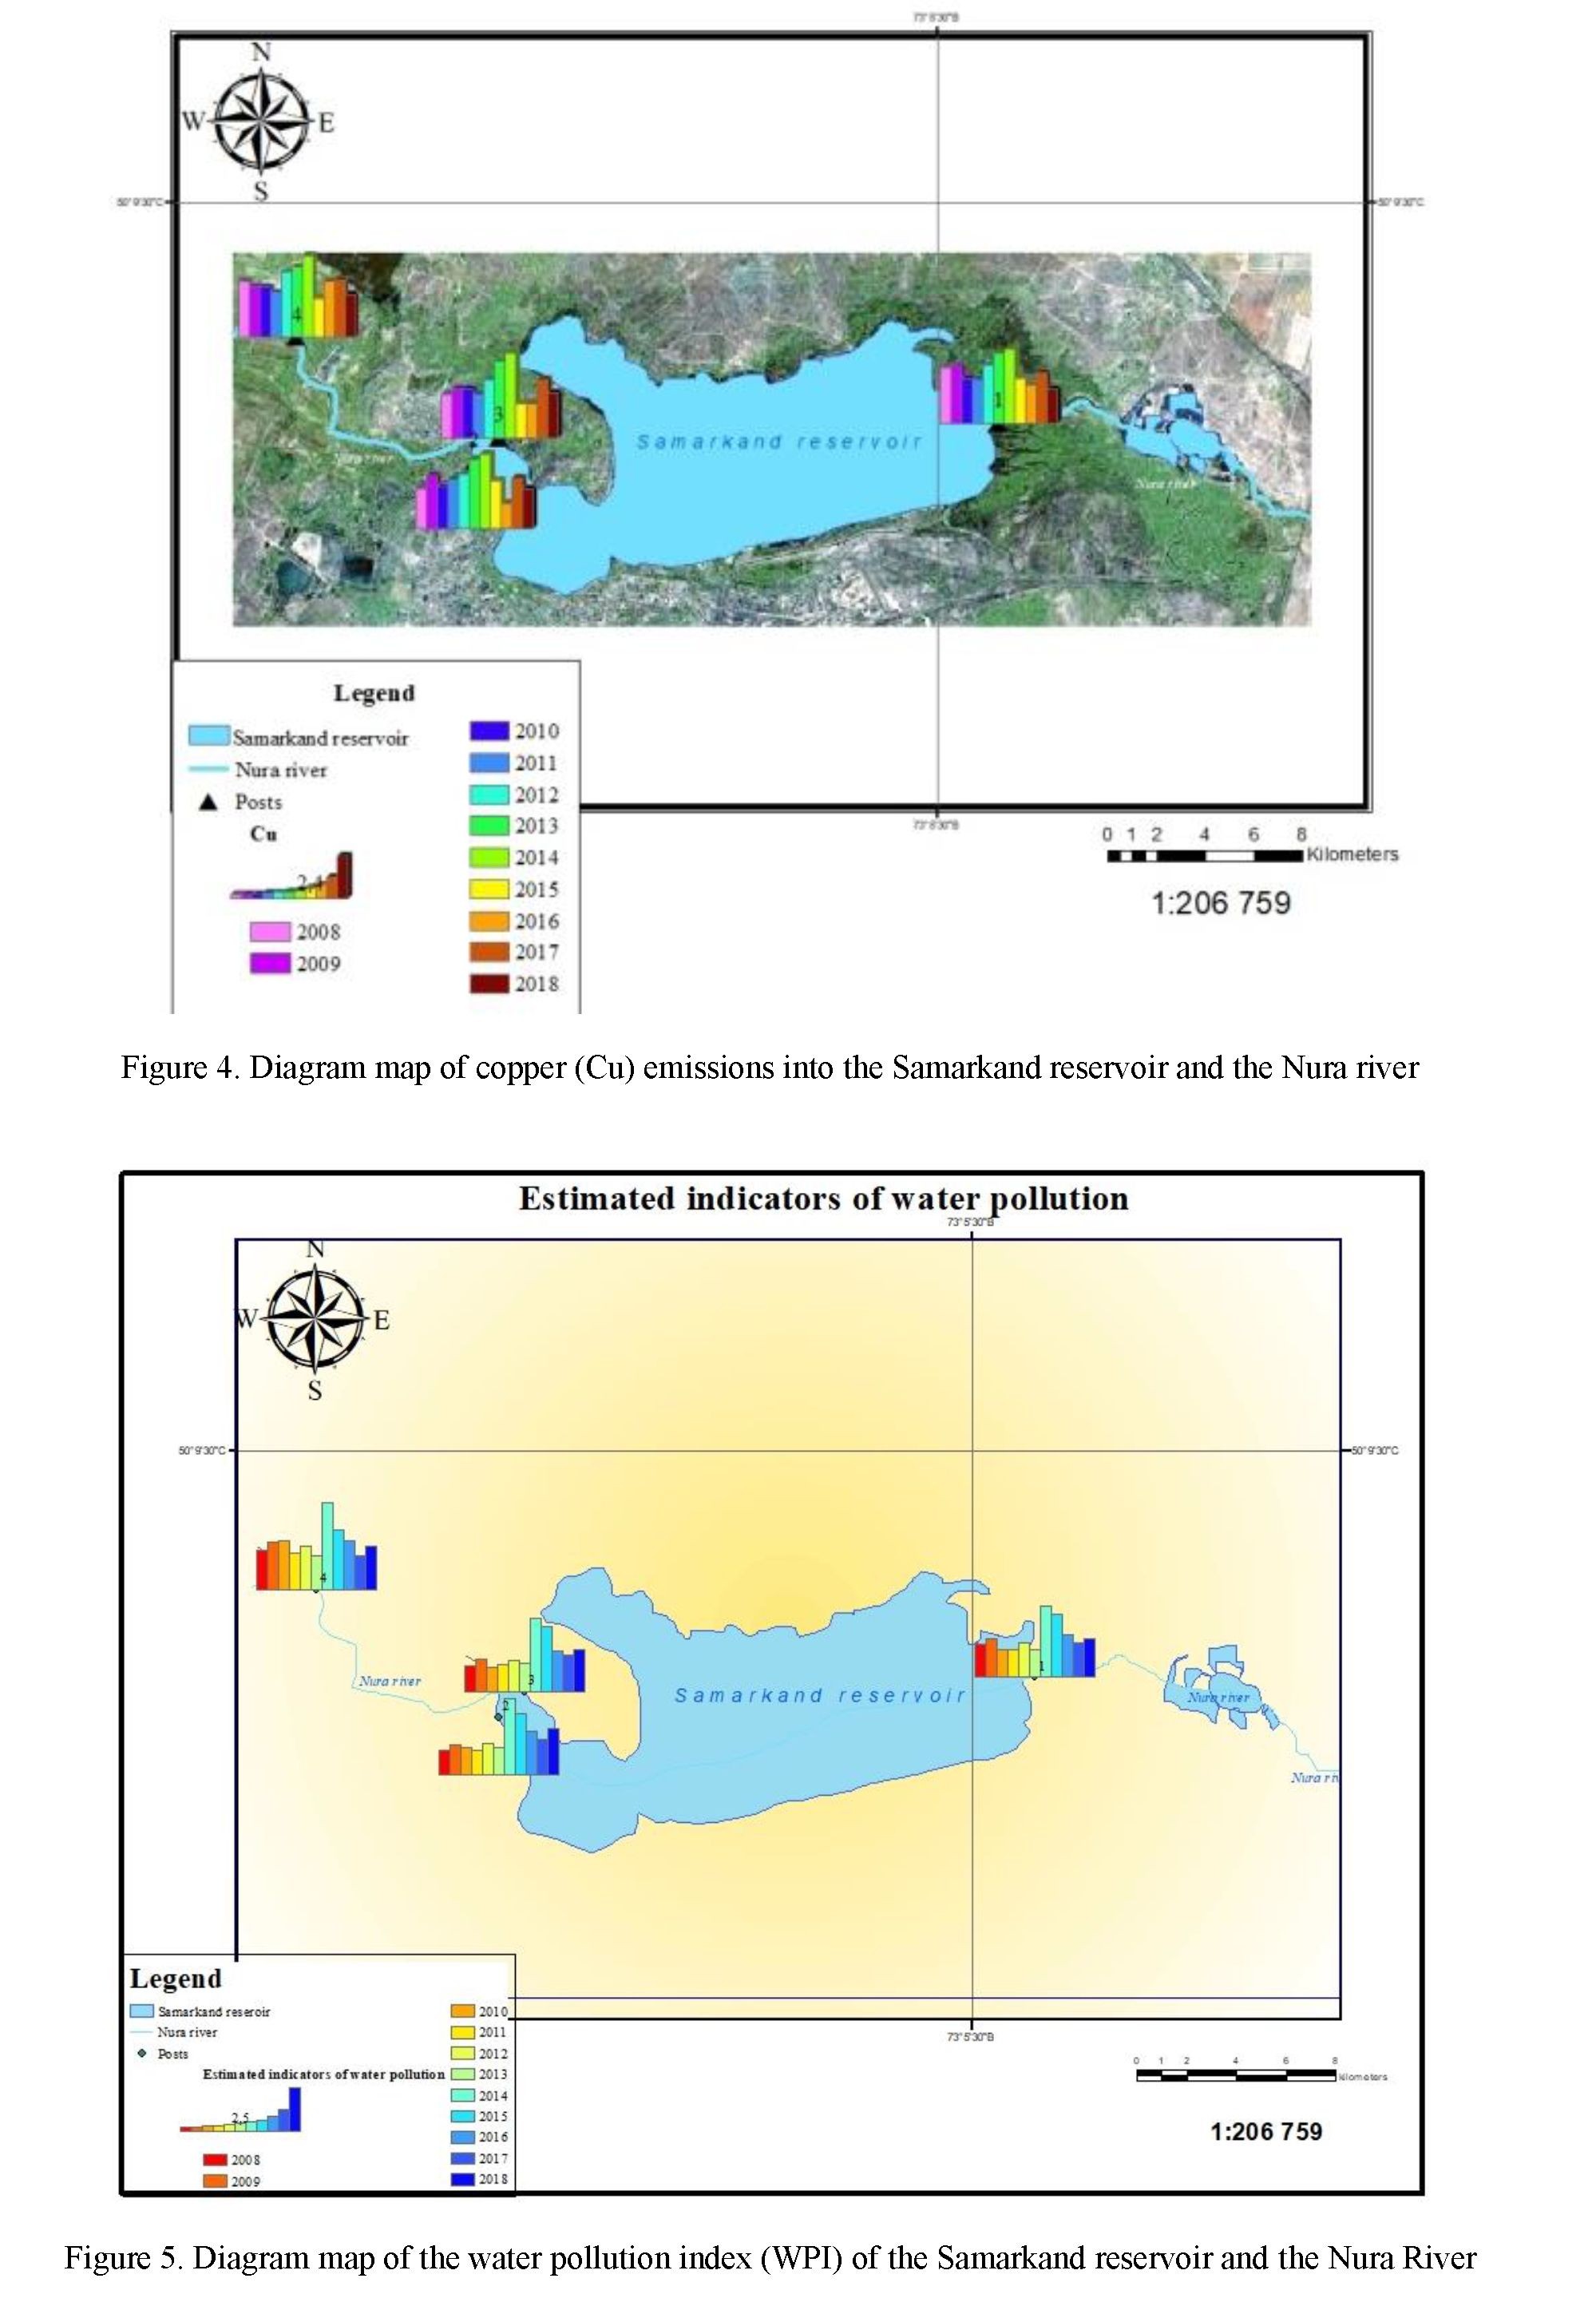
The lowest WPI value is characteristic of the Nura River above the waste water discharge channel; a fairly low WPI value is also characteristic of the Samarkand reservoir. A significant polluting effect on the river is exerted by the channel of the combined discharge of waste water, both in the discharge area itself and downstream.
Using the example of surface water pollution for the period from 2008 to 2018, the WPI indicators were calculated.
Based on surface water pollution data, chart diagrams were compiled reflecting the dynamics over 10 years for common pollution since zinc, sulfates, copper and manganese, as well as for estimated water pollution index of water pollution index.
Conclusion
The state of surface water quality of the Samarkand reservoir shows an excess of the TLV for copper, zinc and manganese.
According to data from 2008 to 2018 water quality is estimated by a set of hydrochemical indicators of four points. As the results of the study showed, the average annual concentration of sulfates, manganese, copper, zinc has increased values at 2 and 4 points compared to1 and 3. They are characterized by maximum TLV values with a large spread in all indicators for the period under consideration. On the example of surface water pollution for the period from 2008 to 2018 using initial data, they prove that industrial facilities affect the quality of water in a reservoir and a river. As can be seen from the list, the greatest danger to the object under consideration is metal pollution. The main pollutants for these substances are Arcelor Mittal Temirtau JSC and the chemical and metallurgical plant Temirtau Electrometallurgical Plant JSC. As the calculations showed, the state of the quality of water resources can be attributed to the class of moderately polluted waters.
References
- Levin, Yu.Yu. (2014). Dinamika sovremennoho sostoianiia vody Cheboksarskoho vodohranilishcha na territorii Nizhehorod- skoi oblasti [Dynamics of the current state of water of the Cheboksary reservoir in the Nizhny Novgorod region]. Uspehi sovremennoho estestvoznaniia — The successes of modern science, 2, 94–100 [in Russian].
- Kljopov, V., & Ragulina, I.V. (2017). Otsenka kachestva vodnykh resursov v verhnei chasti basseina reki Moskvy [Assessment of the quality of water resources in the upper part of the Moscow river basin]. Prirodoobustroistvo — Environmental Engineering, 3, 14–21 [in Russian].
- Lazareva, G.A., & Klenova, A.V. (2015). Otsenka kachestva poverhnostnykh vod po intehralnym pokazateliam (na primere Verhnevolzhskoho vodohranilishcha) [Assessment of surface water quality by integrated indicators (on the example of the Upper Volga reservoir)]. Sovremennye problemy nauki i obrazovaniia — Modern problems of science and education, 6, 621–622 [in Russian].
- Leshan, I.Yu., & Brekhova, I.N. (2016). Kartohrafirovanie ekolohicheskoho sostoianiia poverhnostnykh vod [Mapping the environmental status of surface waters]. Aktualnye problemy humanitarnykh i estestvennykh nauk — Actual problems of the humanities and natural sciences, 8–2, 70–72 [in Russian].
- Newsletter about the environment of the Republic of Kazakhstan (2008–2018). ecogosfond.kz Retrieved from http://ecogosfond.kz/orhusskaja-konvencija/dostup-k-jekologicheskoj-informacii/jekologijaly-zha-daj/orsha-an-otrany-zhaj-k-ji-tu- raly-a-paratty-bjulletender
- Shabanov, D.I., Iolin, M.M., Bezuglova, M.S., Borzova, A.S., & Beljakova, Yu.V. (2017). Sozdanie heoekolohicheskoi karty zahriazneniia okruzhaiushchei sredy na baze heoinformatsionnykh tehnolohii [Creating complex environmental pollution map of the territory of astrakhan region using GIS]. Heolohiia, heohrafiia i hlobalnaia enerhiia — Geology, geography and global energy, 3(66), 217–223 [in Russian].