А тyear before the end of the state program on forced industrial-innovative development (SPFIID) it is advisable to assess its intermediate results in terms of impact on the macroeconomic situation in Kazakhstan and achieved level of target indicators.
The main aim of the Program was, as mentioned in the Presidential Decree of March 19, 2010 № 958, “to ensure diversifi cation and increase competitiveness of the economy”, which implies the reduction of its raw material orientation, the development of advanced production, increase of labor productivity and growth of other quality indicators of functioning. These objectives are refl ected in the target objectives of the Program, including aggregated macro-level indicators, which include the following:
- GDP growth of at least 7 trillion tenge, about 50% of GDP in 2008, in real terms, GDP growth will be 15%;
- The share of manufacturing industry in GDP structure to a level of not less than 12.5%;
- Share of non-oil exports to at least 40% of total exports.
At the same time the text of the Program, including the target indicators, was later amended by Presidential Decree of 01.08.2013 № 607. Separately, it can be mentioned that SPFIID presents in the previous edition of 2010 on the website of the Government of Kazakhstan. The structure of the indicators and the values of some of them were changed in accordance with the amendments. In particular, the new version of the Program provides:
- GDP growth in real terms in 2014 — not less than 38.4% by 2008, in nominal terms — by 26 trillion tenge;
- An increase of GVA in non-oil sector in real terms by 2015 will be at least 39.5% compared to the level of 2008; manufacturing industry in real terms by 2015 will be 43.6% compared to 2008;
- An increase in the economic value of noncommodity (processed) export — not less than 30% compared to 2008.
Complete differences of the SPFIID goals in versions of 2010 and 2013 are shown in Table 1, where each of them is presented in the statements under “Passport Program”, in which target indicators are mentioned.
Thus, after three and a half years after the adoption of SPFIID and in less than half a year before its closure, a substantial adjustment of the Programs concerning the target indicators, especially those which had a relative expression (the share of manufacturing industry in GDP, the share of non-oil and gas exports, the share of exports in industrial output) was carried out. If in the fi rst edition the target indicators were generally consistent withits innovative and inventive industrial orientation, in the second edition the main emphasis of these indicators had shifted towards increasing of the share of local content in the procurements (which became 5 out of 11) that is more in line with the objectives of import substitution and protectionism.
Table 1. Differences in composition and performance of the SPFIID target indicators in versions of 2010 and 2013.
|
The Program, approved by Decree of the President of the Republic of Kazakhstan dated March 19, 2010 № 958 |
The Program, as amended by Presidential Decree of 01.08.2013 № 607 |
|
Increase:
Reduction: 1) share of transportation costs in the cost structure of non-oil and gas sector to a level of not less than 8%; 2) GDP energy consumption by at least 10% of the level of 2008. |
Increase:
Reduction of energy intensity of GDP by at least 10% of the level of 2008. |
Considering changing of the goals of SPFIID that occurred in 2013, should be specially noted that relative parameters have disappeared out of the number of target indicators (the share of manufacturing industry in GDP, the share of non-oil and gas exports, the share of exports in manufacturing industry products). Their place was taken by the volume growth rates, which do not provide the ability to track the qualitative changes in the economy, which the Program was originally directed to. At the same time, those target indicators from the list a year and a half before its completion have disappeared, on which three years later, the situation has not improved and it became clear that their achievement by 2014 is not possible. Table 2 lists these indicators and their dynamics since 2008, selected in the Program as a reference point.
The key indicator from the data in Table 2 is the share of manufacturing industry in GDP, which in 2000 was 16.5%, but has since declined steadily, despite the fact that its growth consistently was mentioned in specialized programs, starting with the Strategy of Industrial-Innovative Development of Kazakhstan for 2003-2015, where this indicator also featured in the list of target ones, and was expected to reach 13% in 2015. As can be seen from Table 2, in the process of implementation of SPFIID, the share of manufacturing industry in GDP continued to decline — from 11.8 in the base 2008, to 10.5% in the fi rst nine months of 2013.
As for the share of non-oil and gas exports at the level of 40%, this indicator was initially unrealistic, because it assumed almost twofold increase of export in manufacturing industry in terms of intensive oil development (the same Kashagan, which was supposed to launch in 2013) and a corresponding growth in the volume of exports of hydrocarbons.
Considering other indicators of macro-level (except for them, there are many sectoral indicators in the Program), it should be noted that their achievement is also problematic. To monitor the implementation of the Program by the Agency for Statistics, a system of statistical records of the majority of its target indicators (not only the macro level, but also industrial and functional) was organized, in frameworks of which a special Statistical Bulletin “Indicators of the State Program of Forced Industrial-Innovative Development of Kazakhstan for 2010-2014” is produced. In accordance with data of this bulletin, not only relative indicators, which were excluded from the number of target ones in the 2013 edition, but also the dynamic performance of the same version of the Program is unlikely to be achieved (see Table 3).
Closest to the target level, in our opinion, may be GDP growth, although this growth is unlikely to reach the target level of 38.4%. Even if we assume that GDP growth in 2013 will coincide with government estimates and will be 6%, then, to enter the fi nal 38.4% in 2014, GDP should grow by 6.5%, that in the current circumstances is unlikely.
Table 2. Target indicators, which were presented in the edition of STFIID in 2010 and which disappeared in a similar list of a passport of the Program in 2013.
|
2008 |
2009 |
2010 |
2011 |
2012 |
9 months 2013 |
2014 (target indicator) |
|
|
The share of manufacturing industry in GDP, % |
11,8 |
10,9 |
11,3 |
11,4 |
11,3 |
10,5 |
12,5 |
|
The share of non-oil and gas exports, % |
27,8 |
27,4 |
27,6 |
23 |
24,7 |
23,2 |
40 |
|
Labor productivity in agriculture |
360,1 |
415,2 |
372,3 |
492,3 |
410,9 |
517 |
720,2 |
Table 3. Dynamic of the main macroeconomic indicators in comparison with the target reference of SPFIID.*
|
2008 |
2009 |
2010 |
2011 |
2012 |
2014 (target indicator) |
|
|
GDP increase in real terms |
100 |
101,2 |
108,6 |
116,7 |
122,5 |
138,4 |
|
GVA Increase of non-oil and gas sector |
100 |
98,1 |
105,4 |
113,9 |
123,4 |
139,5 |
|
GVA of the manufacturing industry sector, in real terms to the level of 2008 |
100,0 |
97,2 |
110,4 |
118,7 |
122,3 |
143,6 |
|
The share of innovatively active enterprises, % |
4 |
4 |
4,3 |
5,7 |
7,62 |
10 |
* Source: Statistical Bulletin “Indicators of the State Program of Forced Industrial-Innovative Development of Kazakhstan for 2010-2014”. January-December, 2013. Agency for Statistics of the Republic of Kazakhstan. Astana, 2014
Even less realistic is to achieve the target indicators concerning the growth of gross added value of non-oil and gas sector to 39.5% (however, this growth can be achieved by acceleration of non-oil and gas services) and, especially GVA of manufacturing industry. Achieving its target level of 43.6% by the latter indicator is almost impossible, and in this sense the replacement of the relative rate of the share of manufacturing industry in GDP with a dynamic growth rate of GVA did not change the situation — as that and other indicators are similarly not realizable by 2014. In 2013, the growth in the manufacturing industry sector was only 1.6%[32]. This means that the cumulative growth of GVA of manufacturing industry in 2013 compared to 2008 was 124.3%, and to achieve the target indicator to 43.6% of cumulative growth of this indicator in 2014, the manufacturing industry is expected to grow by 15.5%, which is absolutely unrealistic.
Thus, we can establish that concerning the key macroeconomic indicators, established by a passport of SPFIID both in its original version and as amended in 2013, the achievement of target indicators will fail. If we do not consider the target indicators related to local content in the procurement of various kinds, which are not directly related to the innovation component, the only macro-level indicators that are likely to be achieved by 2014 are increasing of productivity in manufacturing industry in 1.5 times and reducing energy intensity of GDP by 10%, relatively the levels of 2008. Labor productivity in the industry, according to the bulletin “Indicators of the State Program of Forced Industrial-Innovative Development of Kazakhstan for 2010-2014”, was 37.3 thousand dollars per employee in 2008, which determines the target growth in 1.5 times, with volume of 56 thousand dollars, at its actual size of 61.8 thousand dollars by the end of 2012 and 57.5 thousand dollars for the fi rst 9 months of 2013. Energy intensity of GDP, according to the same source, was 1.77 toe (tons of oil equivalent) in 2008, 1.53 toe in 2012, that is, there was a decrease of 13.5%.
In general, the aggregate target indicators, refl ecting the progress in economic structure and its way towards innovation and industrial progress will not be achieved in any part of the growth in the share of manufacturing industry in GDP, either in terms of the planned rates of its growth relatively to 2008, or in respect of export quality (share of non-oil and gas exports, the growth of non-oil and gas exports), or other parameters (the share of innovatively active enterprises, increase of GVA of non-oil and gas sector). It is possible to consider some of the reasons of actual non-implementation of SPFIID.
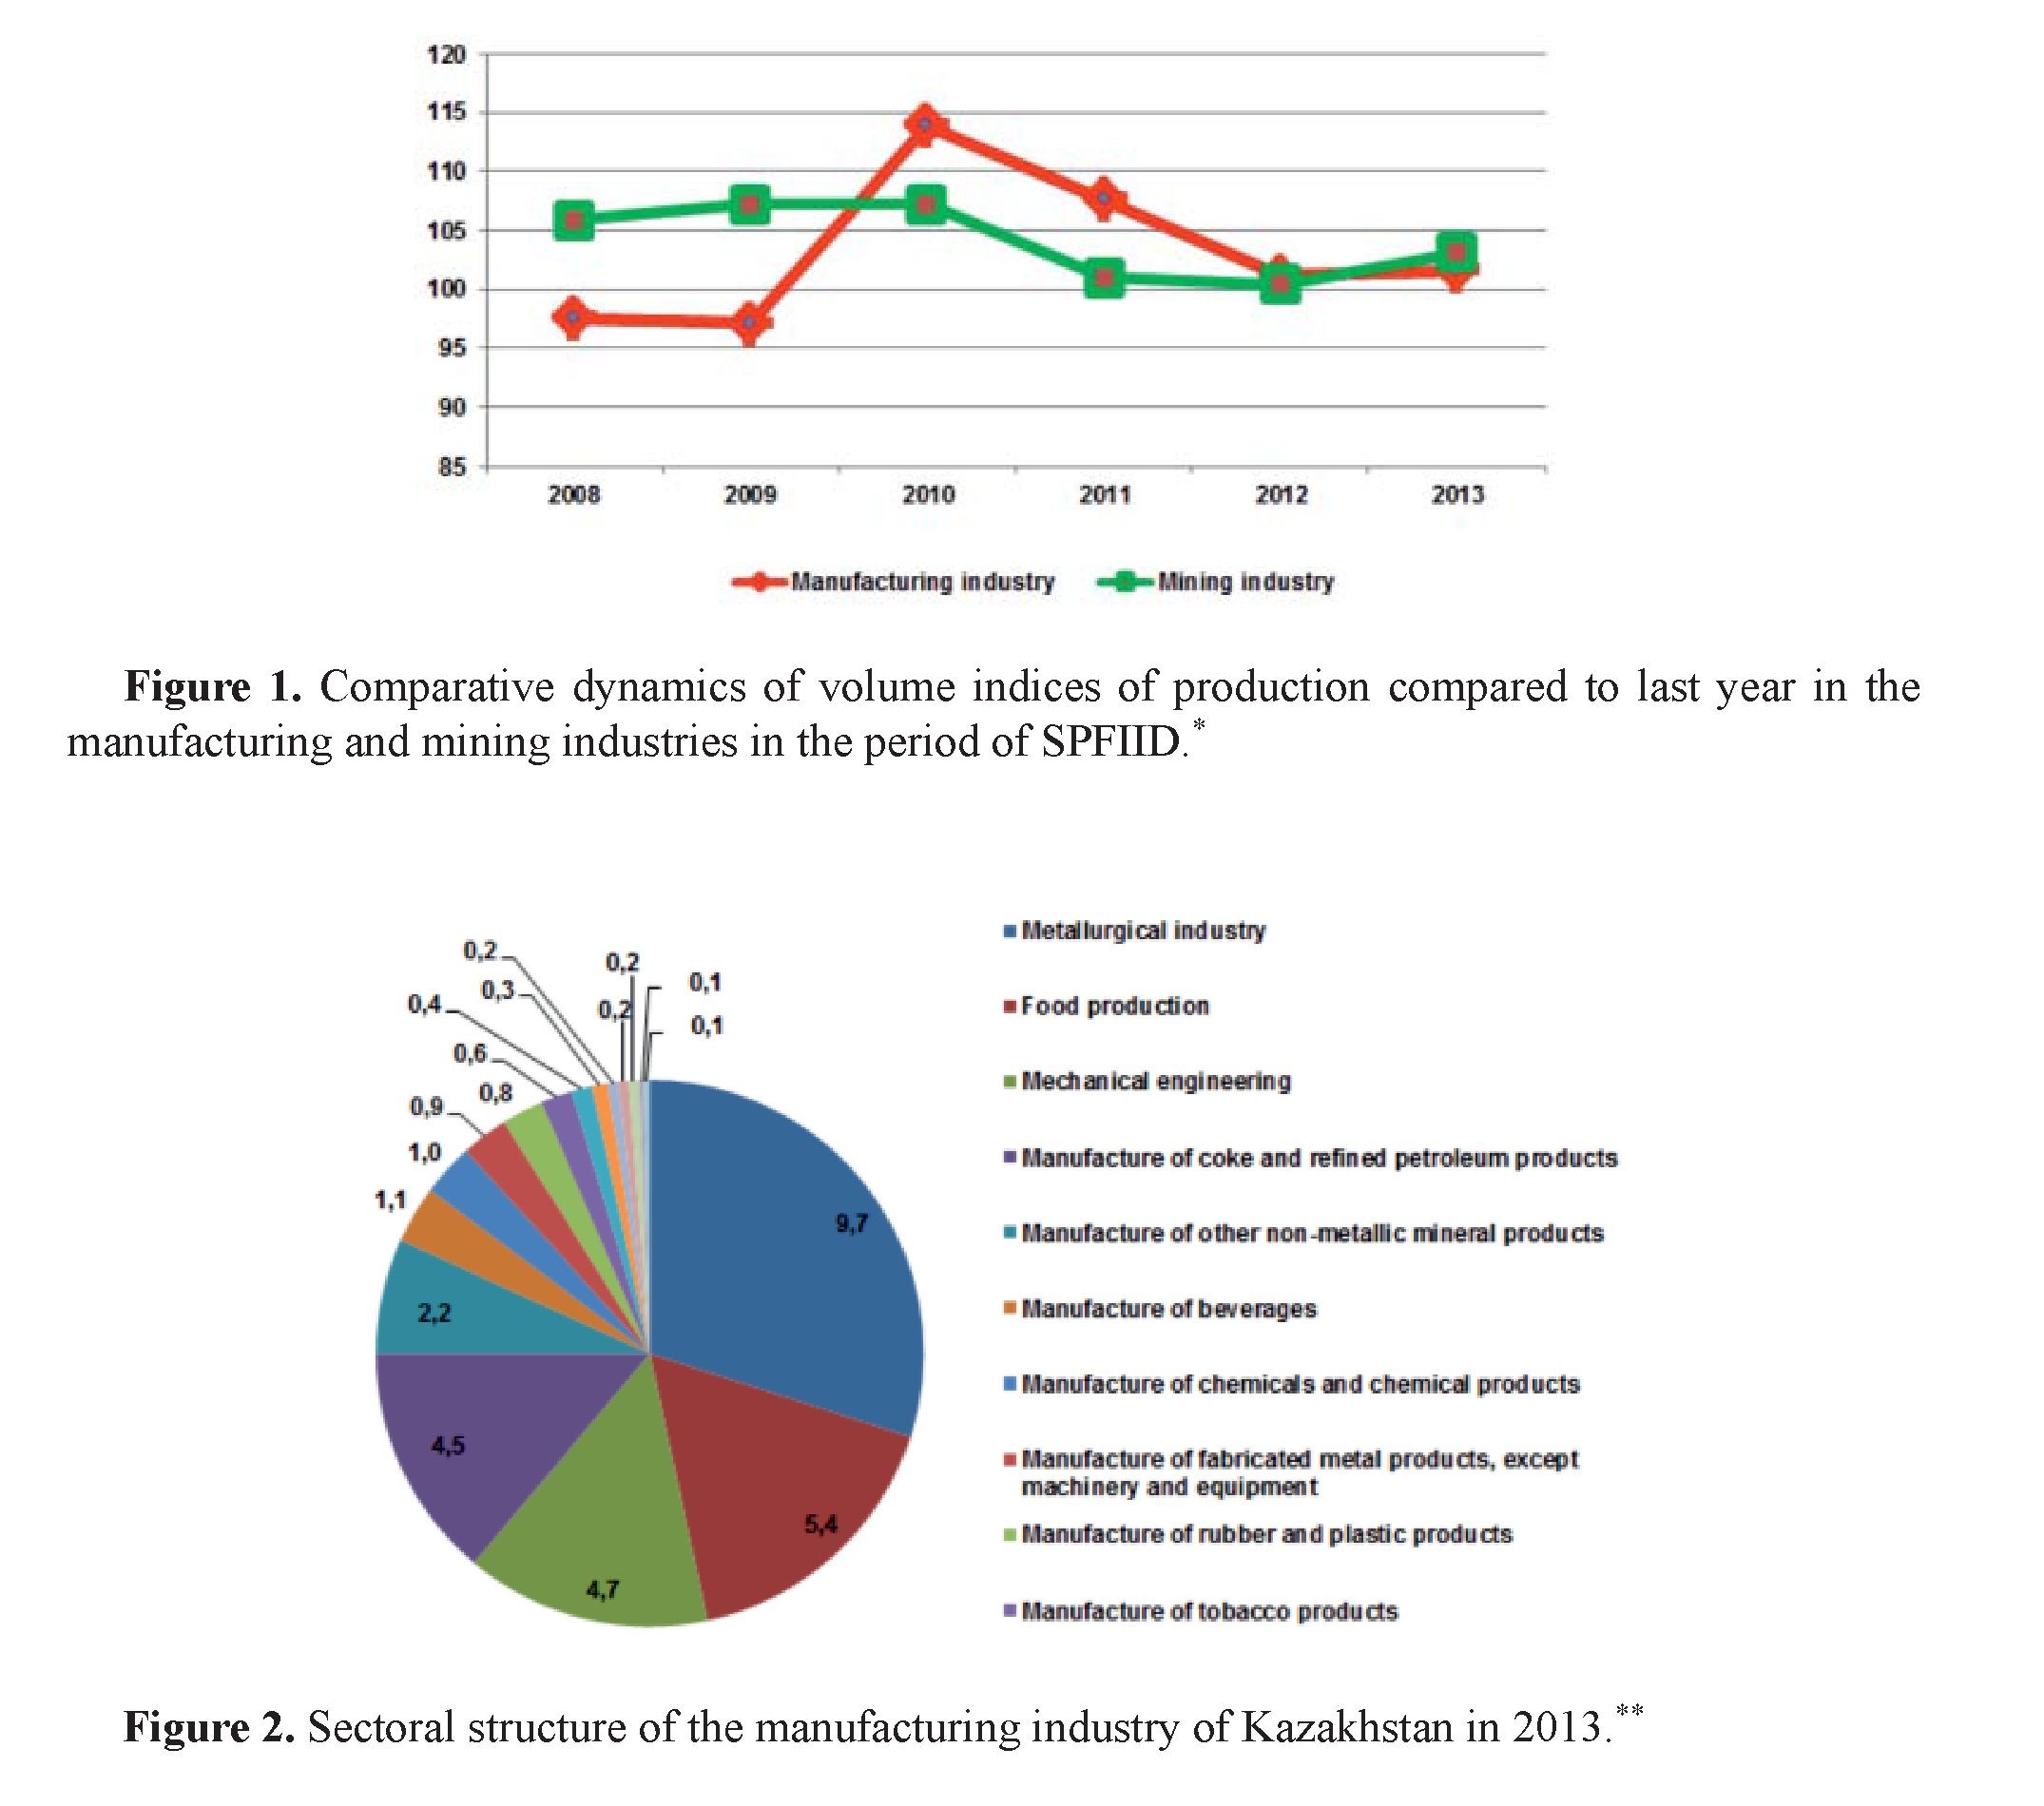
The main reason why the majority of the target macro-level indicators, which characterize the level of development of innovative industries, did not reach the planned targets, is that almost all of these indicators were tied to the rate of growth of the manufacturing industry. In addition to the target indicators that directly refl ect the development of this type of activity, such indicators as the share and growth of non-oil and gas exports, GVA of non-oil and gas sector, labor productivity also directly depend on the growth of the manufacturing industry sector. Accordingly, insuffi cient dynamic growth of manufacturing industry has led to a failure of affi liated to the growth indicators. Despite the fact that during the actual functioning of SPFIID, that is, since 2010, manufacturing industry has grown faster than the extractive industries; there was an inverse situation in 2008 and 2009, which led to the fact that the cumulative growth relatively 2008 in the manufacturing industry sector was almost the same as in the mining industry (Fig. 1).
In its turn, insuffi cient dynamic growth of manufacturing industry is due to its structure in which, despite a few years of implementation of the programs of industrial-innovative development, metallurgy continues to dominate (Fig. 2). Metallurgy, as well as some other manufacturing industries (manufacture of coke and refi ned petroleum products, manufacture of other non-metallic mineral products), forming in total more than half of GVA in manufacturing industry, is highly dependent on world commodity markets and, as a consequence, the entire manufacturing industry in Kazakhstan is as volatile in the results of performance, as prices for metals and other commodity products produced by some of its branches.
For this reason, the dynamic of manufacturing industry output and the associated target indicators of SPFIID, as a result of taken actions in the frameworks of the Program, had changed much less than due to changes in prices for industrial metals. The same price factor of commodity markets conjuncture explains as rise of indicators in manufacturing industry in 2010, when there was a rapid rise in prices for metals, so no less sharp slowdown in its growth in 2012 and 2013, when there were slowing down growth and falling prices in the metal markets. The graph of Figure 3 shows the dynamics of the IMF index of metals, which arranges the prices of copper, aluminum, iron ore, tin, nickel, zinc and uranium, and this graph is quite clearly correlated with both the rate of growth of manufacturing industry in Kazakhstan, given in Figure 1, and the changing role of metallurgy in the manufacturing industry (Figure 4).
- Source: Statistical Bulletin “Indicators of the State Program of Forced Industrial-Innovative Development of Kazakhstan for 2010-2014”. January-December, 2013. Agency for Statistics of the Republic of Kazakhstan. Astana, 2014
- * Source: Key indicators of industry of the Republic of Kazakhstan for January-December 2013. Agency for Statistics of the Republic of Kazakhstan http://www.stat.gov.kz/faces/wcnav_externalId/homeNumbersIndustry?_afrLoop=304200377792585&_afrWindow- Mode=0&_afrWindowId=pw50dldx2_18#%40%3F_afrWindowId%3Dpw50dldx2_18%26_afrLoop%3D304200377792585%26_ afrWindowMode%3D0%26_adf.ctrl-state%3Dpw50dldx2_42
The graphs in Figure 4 clearly show a decrease in the share of metallurgy in manufacturing and industrial production as a whole, which took place exactly at SPFIID period, starting in 2010. In the
same 2010 (at the end) and in early 2011 price maximums on industrial metals were marked, after which the prices steadily declined and pulled over cost values of production of metallurgy, and
- Source: IMF Primary Commodity Prices. http://www.imf.org/external/np/res/commod/index.aspx.
- * Sources: Statistical Bulletin “Indicators of the State Program of Forced Industrial-Innovative Development of Kazakhstan for 2010-2014”. January-December 2013. Agency for Statistics of the Republic of Kazakhstan. Astana 2014; Industry in Kazakhstan and its regions / Statistical compilation / 218 pp. Agency for Statistics of the Republic Kazakhstan, Astana, 2013.
QUARTERLY ANALYTICAL REVIEW
1(53)/2014
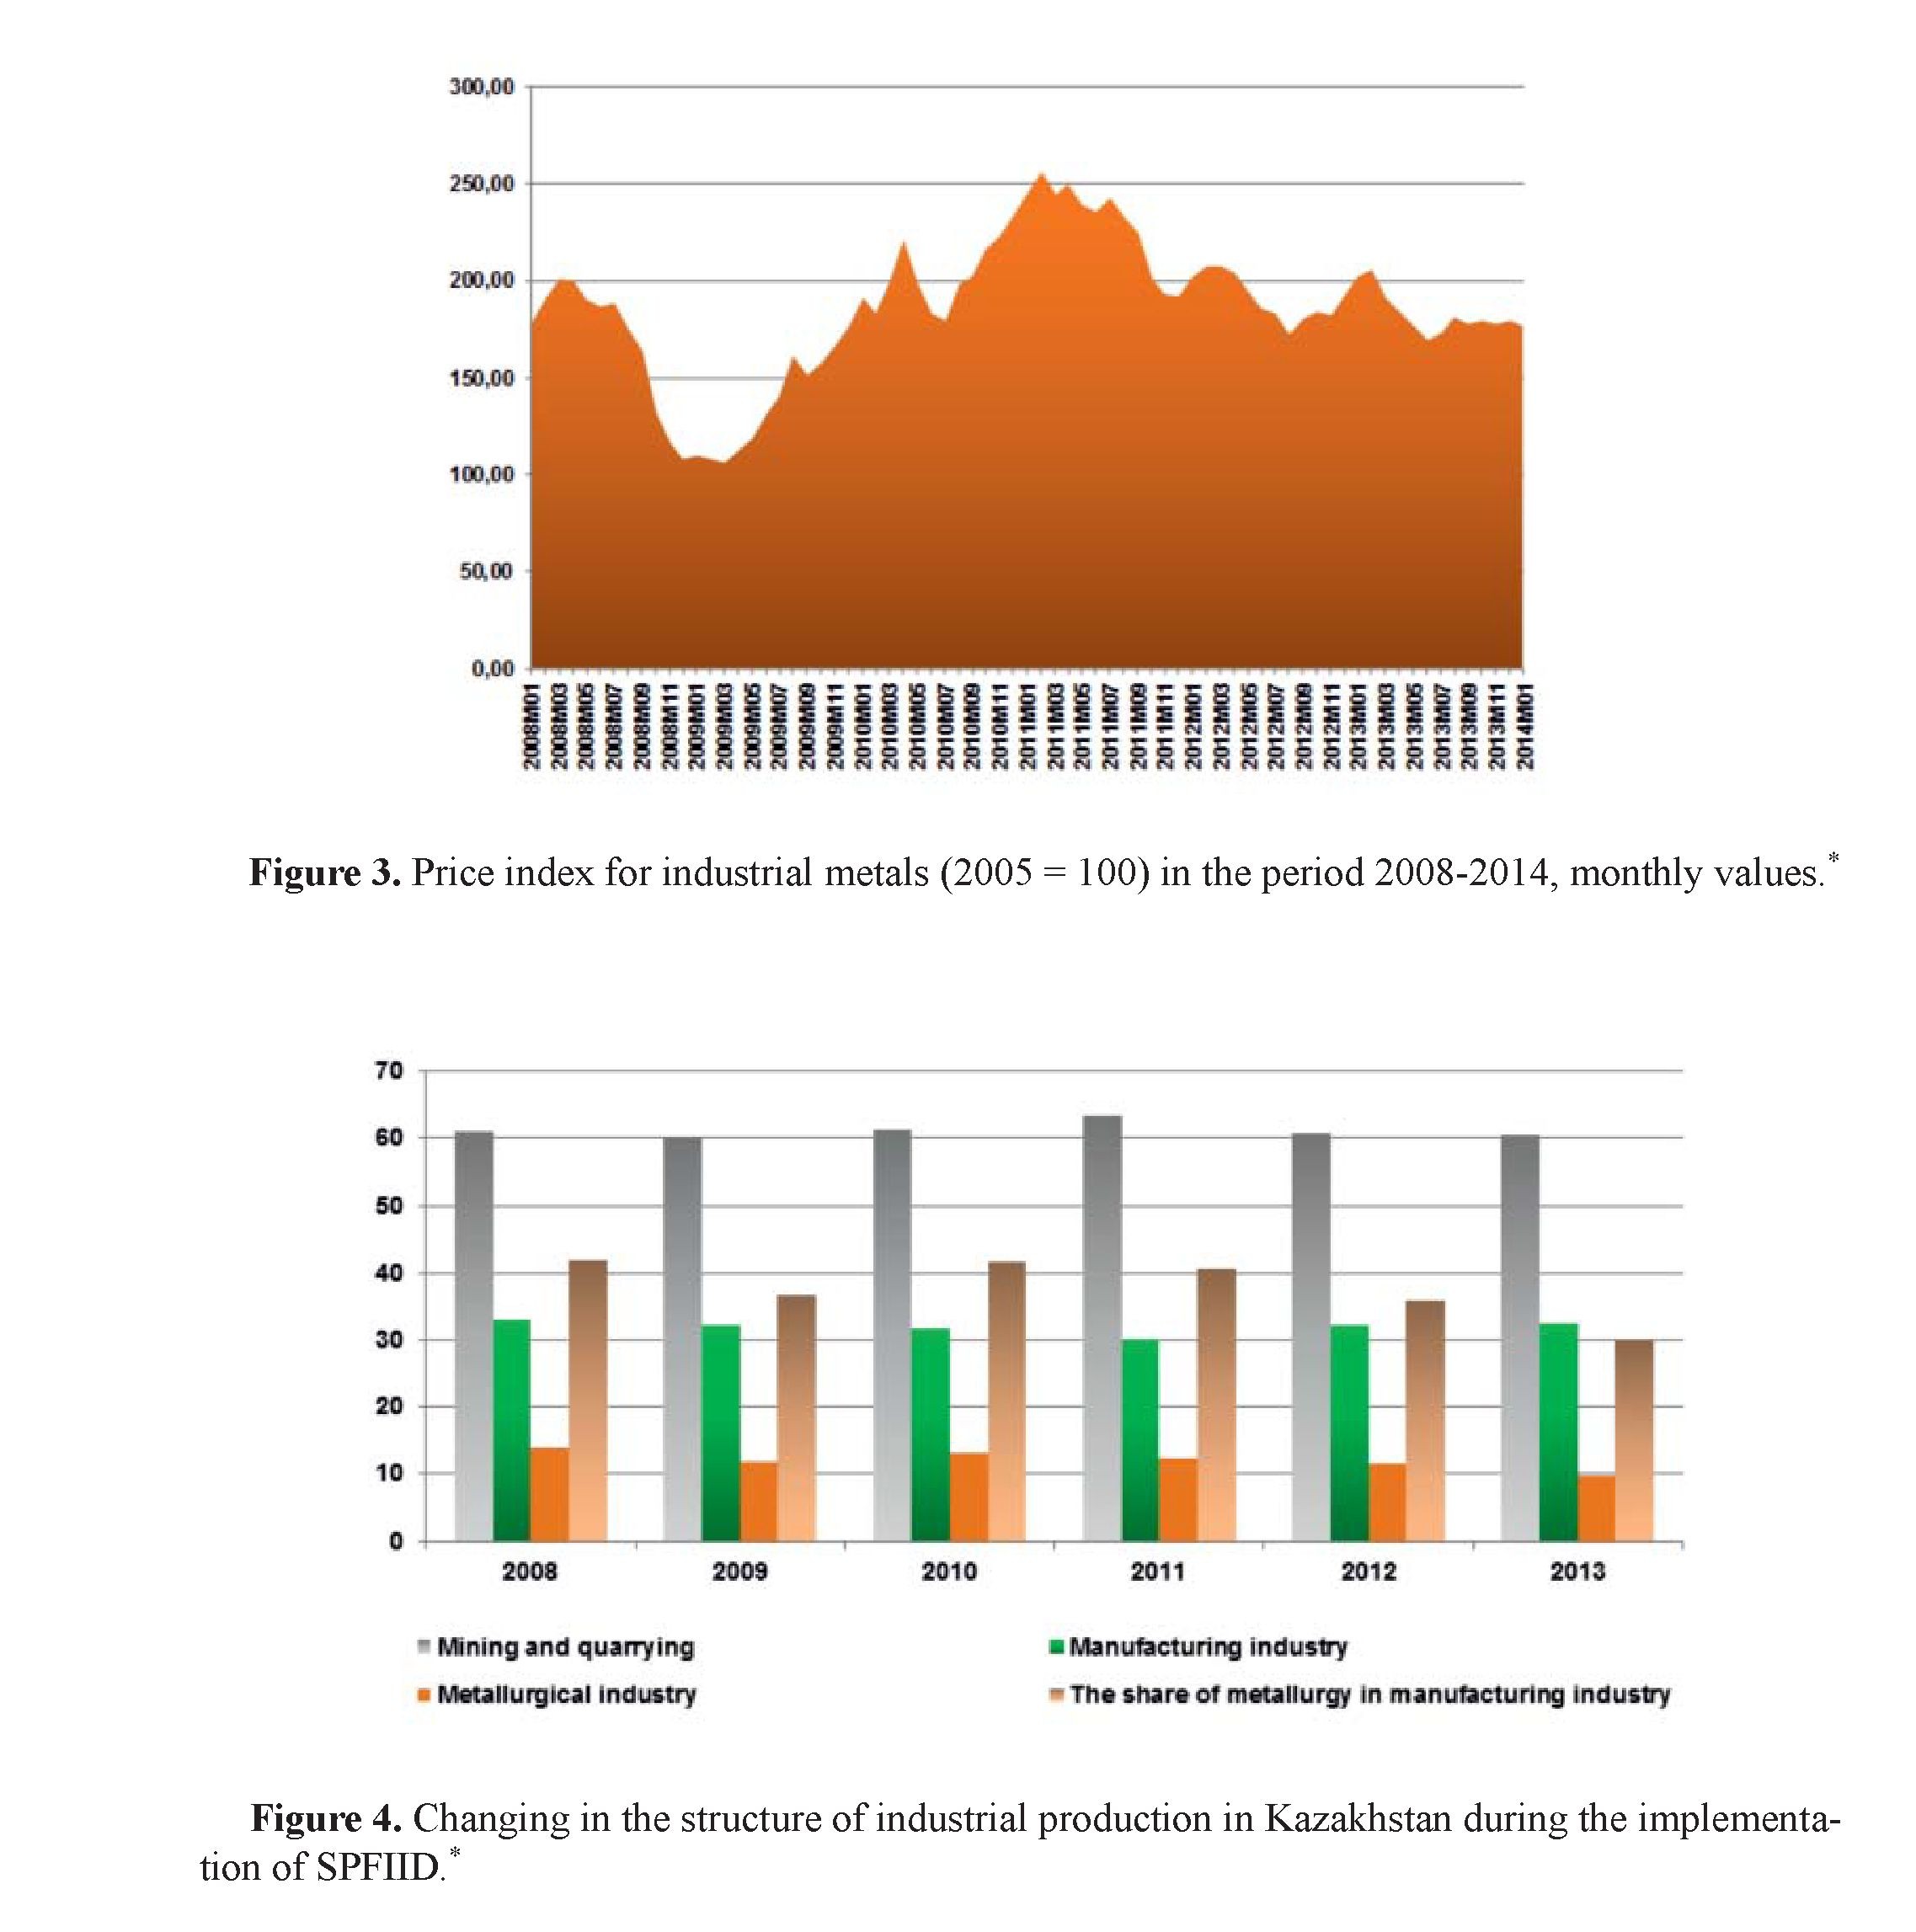
through this industry relevant indicators of manufacturing and industrial production as a whole. In many respects this external factor of unfavorable stock market led to the reduction of the share of manufacturing in GDP, as well as a small reduction in its total industrial production (from 33% in 2008 to 32.4% in 2013).
The same factor may, in the case of changes in market conditions and the growth of prices, produce the opposite effect and increase the share of manufacturing in GDP, exerting thereby a positive impact on the rest of the target indicators of SPFIID — share of non-oil and gas exports, the growth rate of GVA of non-oil and gas sector, etc. Greater impact on the structural indicators of FIID may be made by a decline in oil prices, which will proportionally reduce the share of the mining industry and, consequently, increase the share of the manufacturing industry. However, such changes are not the results of the program, which is in the current state of Kazakhstan industry (where the branches, dependent on world commodity markets continue to dominate), is not likely to have a signifi cant impact on the qualitative change in its structure.
Considered results of SPFIID and factors infl u- encing these results are revealing in terms of the implementation of future programs of industrialization of Kazakhstan’s economy, the course to which is defi ned in the Address of the President to the People of Kazakhstan in 2014, and includes a number of “industrial fi ve-year plans”. In our opinion, a clear defi nition of objectives is required for the greater effi ciency of further efforts to improve the innovation component of Kazakhstan’s industry. In particular, it is advisable to abandon the target indicators of extremely general, aggregate nature (such as growth of GDP or manufacturing industry, increase of the share of manufacturing industry and non-oil and gas exports), because, as was shown above, these indicators, under the present structure of Kazakhstan’s economy, are extremely heavily dependent on external factors, fi rst of all — the prices of commodity markets — and, as a consequence, cannot give an adequate picture of the real rate of industrialization as a result of implementation of the relevant programs.
In this regard, it is necessary to work out clear sectoral priorities of the development of innovative spheres; to scope the target indicators of development that accurately refl ect the process (not just the growth rate of a particular industry, and the volume of its GVA, level of Kazakhstan’s localization of high-tech industries; natural production volume, etc.); to support with the tools of the Program only really high-tech and innovative industries, without diverting efforts on many fronts, including not only unrelated to innovative industries, but generally non-industrial, as it happens in the current SPFIID; to make an emphasis on the development of large-scale industries with high export potential instead of implementing many small projects aimed at import substitution in the domestic market.