The article is devoted to problems of stating the complex index of anthropogenic impact (IAI) formation estimating the ecological stress level in regions of Kazakhstan. A system of indicators of anthropogenic stress for ecological monitoring is justified as different methods of normalization and aggregation of indices. Results of various estimations are provided. Factors of transformation of territorial structure of pollution are revealed. IAI shows that in the post-Soviet period, inherited ecological problems and new sources of impact determined the anthropogenic impact spatial shift at the regional level from the North and East to the South and West. Industry is losing its status as the main source of anthropogenic impact (AI), so densely populated areas and the increase in associated impact indicators have caught up with industry. The population outflow in Northern Kazakhstan has a positive effect on the AI level and increases AI in Southern Kazakhstan. The entire variety of scenarios for the dynamics of the impact of material production on the environment can be reduced to four types: ecological degradation, when an economic downturn is accompanied by increased environmental pollution; depressive development, when an economic downturn is accompanied by decreased pollution; extensive ecological development, where economic growth is accompanied by increased pollution; balanced development, when economic growth is accompanied by decreased pollution. During crisis years, there was a decrease in industrial pollution, the volume of atmospheric emissions and polluted wastewater, and, to a lesser extent, water consumption; conversely, vehicle emissions, the volume of toxic waste, the area of disturbed lands, and forest fires do not depend on the change in GRP. Despite the fact that for the country as a whole, the dependence of the level of pollution on the level and dynamics of economic development is weakening, with each new crisis, there is an increasing number of regions where the environmental state continues to deteriorate despite the economic downturn.
Introduction
Ecological status is gradually becoming a significant factor of regional growth in former Soviet countries. Large-scale social and economic, institutional and technological changes since the early 1990s occurring in the course of the economy's adaptation to market conditions and inclusion of post-Soviet countries in the world market have considerably affected the environment, especially at the regional and city level. The past quarter of the century has seen dramatic changes in the ecological status (ES) in Kazakhstan. New conditions have made their appearance and the importance of ES formation factors has changed: The role of technological factors has gradually decreased; the role of structural industry shifts has increased since it was relatively high-tech processing industries that experienced maximum output reduction. The greater rawmaterial orientation of economy in Kazakhstan has amplified anthropogenic impact on mining regions, while the largest cities faced a rapid growth of automobilization being an important factor of anthropogenic impact. Institutional mechanisms have not succeeded in producing ES territories; environmental payments do not stimulate a greener economic activity though large private business possesses considerable financial resources for production modernization.
At the same time, the environmental conditions in the industrially developed former Soviet countries rich in natural resources, in particular, Kazakhstan, still bear the features inherited from the period of the Soviet industrialization. Their role can be revealed through a comparative study of the two countries, the industrial complex of which was formed within a single space.
Integral index of anthropogenic impact has been developed to assess changes in environmental conditions in the regions of the Republic of Kazakhstan. The scale and method of the research were chosen based on availability of statistical information for various levels and time periods, comparability of environmental indicators in Kazakhstan and adequacy of the available statistics. In addition to the analysis of the impact of key factors and trends in the ecological status, a comprehensive assessment of the transformation of environmental and economic situation caused by changes in branch and territorial structure of the regional economy is needed. The comprehensive assessment lays the basis for a greater efficiency of environmental investment.
Experimental
Integral indices of environmental conditions started to appear almost simultaneously in the USSR and in the West. However, differences in development conditions of this research method and its purposes, impossibility of sharing practices predetermined separate ways at the initial stage of formation of complex indices. Generalizing the available experience of foreign scientists, governmental and international commissions in this field, it is possible to identify a number of features. First, the use of basic indicators (GDP, gross domestic savings, net domestic product) is normalized based on the cost estimate of depletion of natural resources, ecological damage, natural capital [1–3]. Second, there are integral indicators of sustainable development (ecological sustainability, real progress, etc.) including both indicators of quality of life and ecological indicators [4, 5]. The third important feature is the initial orientation towards the search of indicators reflecting a contribution of the countries to global problems, i.e., ecological footprint, living planet index [6]. Finally, proper environmental indices based on either indicators of anthropogenic impact (air emissions, waste water) or "environmental efficiency" (impact of an ecological factor on human health and ecosystems) [7–9].
Kazakhstan needs a multi-scale environmental research: Country assessments lacking a regional component are unacceptable for countries as vast as they are. Sub-regional assessments are even more promising; however, the ecological statistics at the level of districts and municipalities is too scarce for a comprehensive complex assessment of anthropogenic impact over time. Thus, two levels have been chosen for the research: country and regional, allowing assessment of industry-specific and territorial shifts of areas of anthropogenic impact over time.
Key problems which researchers face while elaborating a technique for impact assessment at the regional level are a weak statistical base, frequent change of calculation procedures and incomparability of some indicators within inter-country comparisons due to various approaches to measurements and calculations. For example, a key group of indicators highly relevant for the assessment of anthropogenic impact connected with the impact on forest resources is less relevant for Kazakhstan. Considering a common group for conventional forests and haloxylon desert woodlands in the Kazakhstan statistics, use of indicators of impact on forest resources demands a careful approach and expert adjustment [10, 11].
Stage 1 included the methodology for the integral assessment of the anthropogenic impact level and the creation of the integral index.
– Selection of priority components. Ecological indicators of almost all significant sources of impact were considered: production sector, power industry, motor transport, agriculture and forestry, population as a source of impact (through household waste and indirectly through other indicators), indicators of radiative effects, and others.
– Selection of indicators for each group was based on the principles of systematicity, reliability, availability of statistics, pronounced territorial differentiation, clearly interpreted dynamics. Each type of anthropogenic impact has a set of absolute and relative (specified in brackets) indicators: A1 — density of air emissions of the production sector and motor transport per the acreage of the cities, production sector, transport; A2 — coefficient of emission toxicity calculated as the ratio of emission volume normalized to a single toxicity to the gross air emission volume; B1 and B2 — share of water consumption and wastewater discharge in surface-water supply, respectively; C1 — solid waste density taking into account their hazard class; C2 —
share of disturbed industrial lands; D1 and D2 — share of cultivated and reclaimed lands respectively; D3, D4 and D5 — mineral, organic fertilizers and pesticides respectively per 1 hectare of arable lands; D6 — cattle livestock per the area of pastures; E1 — share of total standing volume of cut timber; E2 — the area of felling per calculated cut; E3 — share of unauthorized felling; F1 — share of inhabitants in radioactive contamination zones; F2 and F3 — soil pollution density with 137Cs radionuclides of the forests and the area, respectively; F4 — share of lands of the cities, production sector, motor transport polluted by radionuclides; F5 — share of lands of former nuclear test sites and major accidents related to radioactive pollution.
– Translation of initial value matrix for assessment indicators into values normalized for addition of different-sized indicators. The following criteria can be used while selecting normalization principles: the nature of asymmetry of separate indicators, their contribution to the final assessment and interpretation of the totals. While searching for an optimum normalization principle, three most widespread methods were applied: ranking, linear scaling, and logarithmic scaling. Logarithmic scaling proved to be the most acceptable method for the integral index. For the first time, suggested for assessment of territorial differences of anthropogenic impact in the Russian regions, this method not only removes excessive differences of indicators, but also adequately reflects the increasing pollution level parallel to the growing integral index [12].
where E0 and Et are indicators characterizing the negative impact on the environment in the base and current periods (volume of emissions, wastewater, waste, volume of water consumption); Y0 and Yt are GDP in comparable prices of 2005 in the base and current periods, respectively. A positive value of the coefficient Dt indicates that the increase in value added is accompanied by a decrease in the burden on the natural environment, and a negative value indicates the absence of a decoupling effect.
Stage 3. Correlation between changes in IAI and dynamics of economic indicators.
The entire variety of scenarios for the dynamics of the impact of material production on the environment can be reduced to four types: (1) ecological degradation, when an economic downturn is accompanied by increased environmental pollution; (2) depressive development, when an economic downturn is accompanied by decreased pollution; (3) extensive ecological development, where economic growth is accompanied by increased pollution; (4) balanced development, when economic growth is accompanied by decreased pollution [14].
Integral assessment of anthropogenic impact
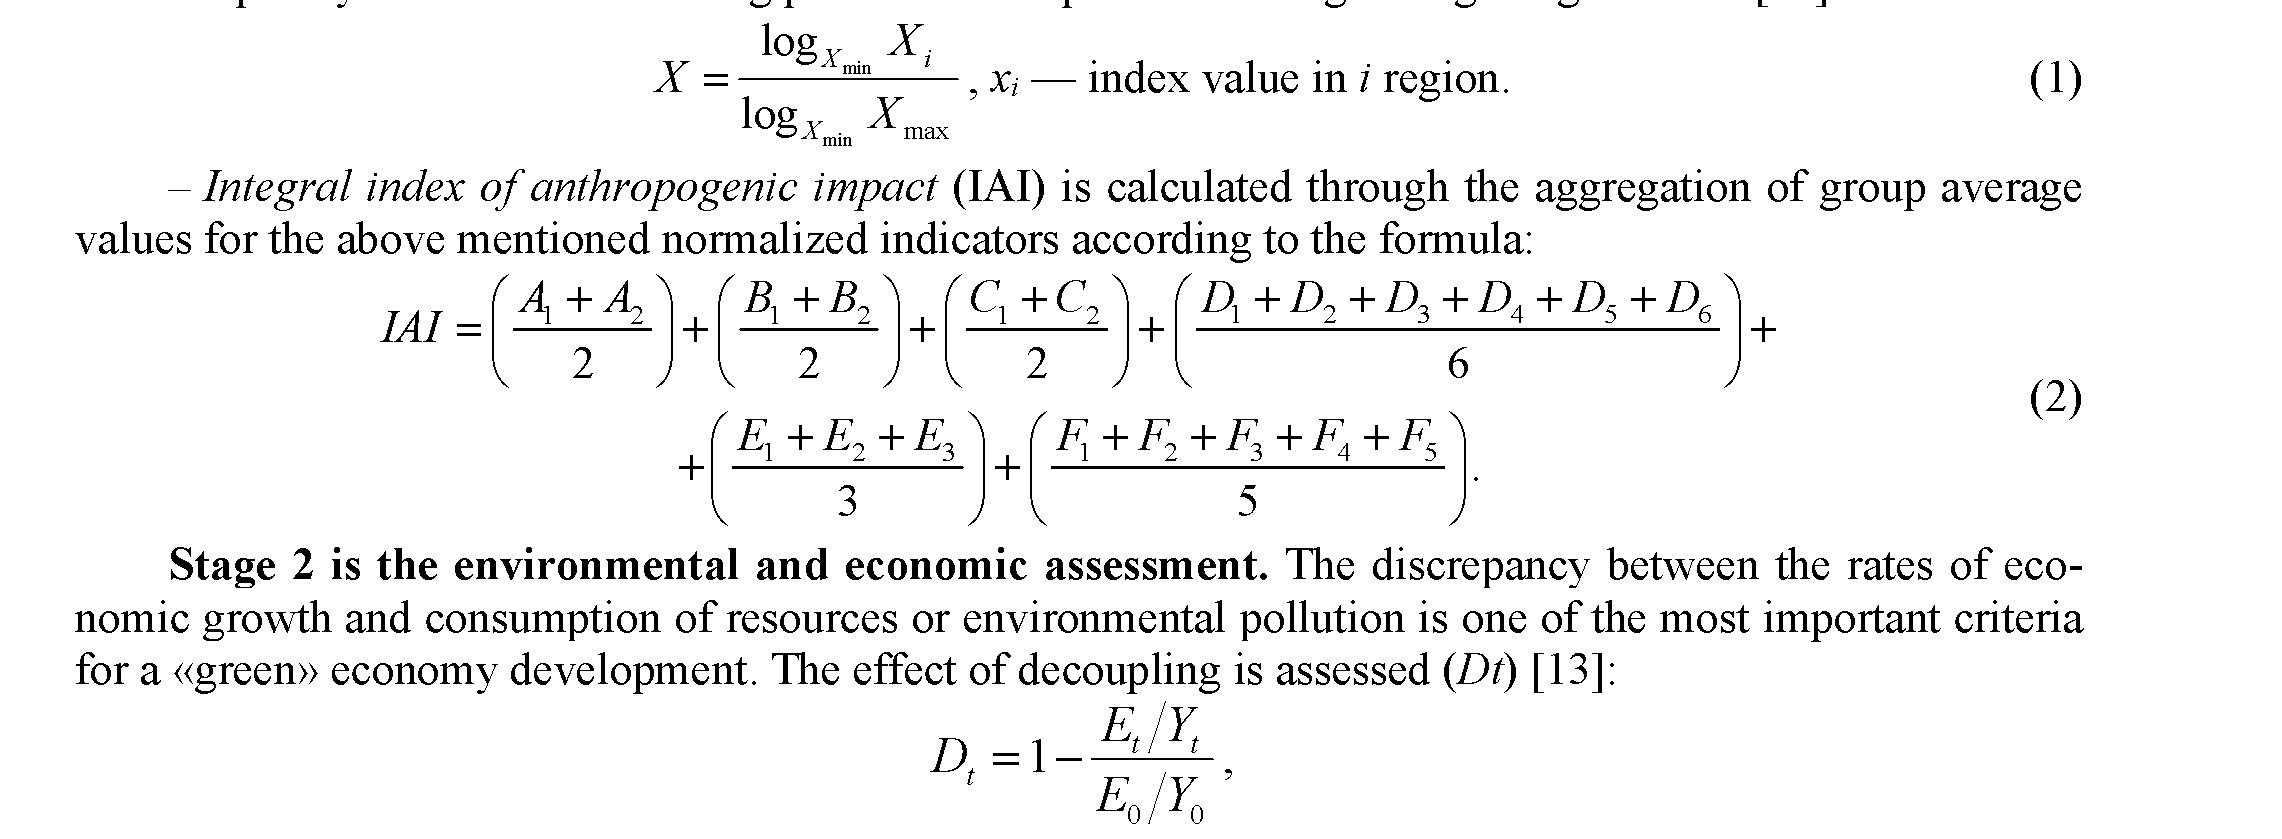
Integral IAIs were calculated for four time periods: 1990 — the beginning of the transition period, 1998 — the end of crisis, 2003 — the end of the first stage of compensatory growth, 2014 — the most recent available statistics. In general, the results demonstrate the adequacy of the developed technique for identification of territorial differentiation of environmental conditions in large countries (Fig. 1).
157
The total index has shown a high, though reducing degree of interregional distinctions in terms of the intensity of environmental pressure on the territory of the two countries (from 3.6 to 1.7 times during 1990– 2020). Various changing trends in individual factors have also determined the dynamics of the complex regional index after the collapse of the Soviet Union.
Decreasing AI has become an underlying trend, and internal fluctuations corresponded to the dynamics of economic indicators. At the same time, in the early 2000s, during the maximum increase in oil prices, pollution volumes moved to the extracting regions with low population density. Unlike the majority of old developed regions where pollution is localized in the cities, the impact is dispersed across the territory in newly developed extracting regions.
Use of pollution density indices (as compared to absolute values of volumes) moves three types of regions down in rankings. First, large regions with an intense, but rather localized AI (Karaganda). Second, regions with large rivers under serious anthropogenic pressure, but with low density of impact (Atyrau). Third, strong agro-industrial regions (Kostanay) have seen an advancing production decline in the leading agricultural regions with the most intensive agriculture since the 1990s. On the contrary, industrial regions with localized and cities of republican status rise in ranking. Agricultural pressure exacerbates ecological stress in traditionally agrarian regions of Kazakhstan — North Kazakhstan and Akmola.
However, centres of ecological stress, unevenly spread across the territory, are the same for any assessment method. In Kazakhstan, the centre of ecological stress, Pavlodar-Karagandy-East Kazakhstan area,
Серия «Биология. Медицина. География». № 2(106)/2022
has actually begun to smear during the considered period due to decreasing impact in the East Kazakhstan region and new centres of ecological stress: oil-extracting West and densely populated South of Kazakhstan.
As in most EAEU countries, in the early 1990s, Kazakhstan experienced a decrease in anthropogenic impact, since 2000, a gradual increase in emissions began and there was a slight decrease in subsequent years. Kazakhstan regions developed differently both during the crisis and during the years of economic growth. A high level of cheap hard and brown high-ash coal availability, ferrous and non-ferrous metal ores has led to a heavy industrial structure formation and the highest levels of anthropogenic pollution for decades in Central and North-Eastern Kazakhstan. All major centers of atmospheric pollution are concentrated here (73 % of air emissions from stationary sources). In metallurgy, the utilization level of toxic substances is traditionally at an average level and, as a result, the regions of its deployment are the emissions source of the most toxic substances. In the Pavlodar region, the largest polluters are the centers of refineries, thermal power plants (Aksu and Pavlodar), and since the 1960s, an energy-intensive aluminum industry has appeared here, which has created a toxic environment in the city. Energy-intensive ferroalloy production appeared on imported quartzites from the Urals in Aksu and Ekibastuz. The emissions’ volume in the region was 3 times less than in the Karaganda region, also because there is a high level of emissions purification, mainly due to the utilization of solid compounds from the high-ash coals combustion. However, the Karaganda region has significantly reduced emissions and is now in the second place after the Pavlodar region.
The powerful development of thermal power engineering also determined the largest water intake and wastewater volumes (over a quarter of wastewater discharges in Kazakhstan). Although a significant part of CHP effluents are cooling relatively clean water, with such a high coal mining concentration, metallurgy, chemistry and heavy engineering enterprises, warm water discharged from CHPs creates the problem of synergistic impact.
The consequence of accelerated industrialization to nowadays is environmental problems in the east of the country. The smelting of titanium, magnesium, lead and zinc is a source of highly toxic emissions in Ust- Kamenogorsk and the oldest center of the lead-zinc industry in Altai — Ridder city, operating on their own concentrates. This form of organizing the non-ferrous metals production in the form of large full-cycle plants is associated with the peculiarity of their ores — a low content of pure metal (1–5 %), and even less than one scattered.
Thus, inherited development has determined the territorial concentration level of the most «dirty» industries, the creation of large-scale industries without the required level of purification, etc. in the regions of Central, Eastern and partly Northern Kazakhstan. However, their current growth, which has also led to an increase in pollution since 1996, is associated with the demand for their products on the world market. Kazakhstani metals are bought in more than 30 countries of the world. Therefore, the second factor in the territorial dynamics of the ecological state was the globalization impact and the inclusion of regions and cities of Kazakhstan in the world market. It covers the territory of the country unevenly «choosing» the largest cities, regions with the extraction of resources that are in demand on the world market. If for the former inclusion in the global economy led to a decrease in pollution, then for the latter changes in prices for metals and raw materials on the world market had a negative impact on the environmental situation. For the rise in energy prices in stable economies stimulates a reduction in their consumption, and in the conditions of a transforming economy, the focus of which on the export of energy carriers and other resources is only increasing. It leads to the opposite result — a significant increase in resource intensity within the country and an increase in production.
The influence of this factor especially affects the growth of anthropogenic load in the Western Kazakhstan regions. The development of the Embinsky and Mangystau oil and gas provinces and nickel ores in the Aktobe region led to the fact that to this particular region is shifting anthropogenic impact. Only two oil regions (Atyrau and Aktobe regions) in terms of atmospheric pollution by 2005 exceeded the level of 1990. Pollution features in the Western Kazakhstan regions are low anthropogenic impact localization, its exit beyond the city limits into hydrocarbon production areas and the lowest volumes of trapped and neutralized harmful substances due to the low level of associated petroleum gas (APG) utilization. Oil industry enterprises account for the main air pollution share (80–85 %) in Atyrau and Mangistau regions, where the burned gas amount at oil producing enterprises increased from 62 to 65 million m3 in the last year alone.
The massive development of hydrocarbon raw materials is a potential threat to increase the pressure on natural waters, especially the program for the development of offshore fields in the Kazakh sector of the Caspian Sea. The State Program for the Development of the Caspian Shelf provides for special studies to determine the maximum possible level of hydrocarbon production without damaging marine and coastal ecosystems, the implementation of geodynamic monitoring, the elimination of abandoned oil wells and other historical pollution.
Unique and typical factors in the AI spatial structure formation in the Republic of Kazakhstan determined the identification of regions types according to the time of AI sources formation. The inherited development factors of Kazakhstan regions continued to determine the AI levels in most of the old industrial regions: Pavlodar, Karaganda and East Kazakhstan, however, over 25 years of independence, they appeared as new growth centers AI, in which growth is provided by relatively new factors. At the same time, the modernization of metallurgy has led to a significant reduction in pollution in these regions, especially in the East Kazakhstan region.
Population growth, for example, in the South Kazakhstan region, where population growth has changed significantly (15 thousand people per year from 1989 to 1999, 65 thousand people per year from 2009 to 2017), similar processes in Jambyl and Almaty regions, significantly increase the level of anthropogenic impact in these regions. The growth of the rural population most often leads to an increase in pressure on pastures, an increase in sown areas, and in the south of Kazakhstan it causes the greater water withdrawal.
New industrial centers, which include Kostanay and Kyzylorda regions, are still slightly changing the AI map, but in the future, their role will continue to grow. However, the most important factor determining the regional features of the AB transformation is oil and gas production and its environmental consequences in Western Kazakhstan.
The unique factors in the formation of the environmental situation in Kazakhstan are two macro- regional inherited environmental problems — the territory of the Semipalatinsk nuclear test site and the Aral Sea. Unique for the post-Soviet space is the transferring the capital factor, which contributed to the active economic development of the Astana agglomeration, which led to significant environmental consequences throughout the Akmola region. The presence of the Almaty agglomeration, located in complex geological and geomorphological conditions, where the problems of inadequate development of the foothills exacerbated the problem of deteriorating air quality is also one of the unique factors. Among institutional factors there is a greater openness of the economy and, as a result, the work of foreign companies in the extractive industry, which are much more efficient than Kazakhstani and Russian enterprises in terms of specific indicators of emissions, wastewater discharges and waste generation per unit of output.
From the spatial distribution point of view the anthropogenic impact, in addition to the existing central «ridge» of regions with high anthropogenic impact (Pavlodar, East Kazakhstan, Karaganda and South Kazakhstan), another one an oil-producing area in Western Kazakhstan is being formed. Despite the fact that so far only the Atyrau region has average impact indicators, it is obvious that the development and reaching the peak production of large fields (Kashagan, Tengiz, Karachaganak, and others) will move the Western Kazakhstan regions higher in the areas ranking with the highest anthropogenic impact level.
In 8 out of 14 regions of the Republic of Kazakhstan, the integral index has increased over the past 25 years, with Aktobe region becoming the leader in terms of impact growth (there oil and gas fields, expansion of existing metallurgical industries are being active developed). The greatest reduction in the anthropogenic impact level at the regional level is typical for the North Kazakhstan region, where the population has decreased, the impact from agricultural sources has decreased and a number of machine-building enterprises have closed.
The atmospheric impact level increased in three types of regions:
- areas for the development of new mineral deposits (oil fields in West Kazakhstan, Atyrau and Aktobe regions);
- copper deposits (in Central Kazakhstan);
- agglomerations of large cities (Astana, Almaty, Shymkent);
- areas for the start of new large-scale production (Pavlodar, Khromtau, Aktobe).
On the contrary, a decrease in the impact was typical for industrial and agricultural regions of the north (Akmola, Kostanay, North Kazakhstan regions); Rudny Altai (city-factories — Ridder, Zyryanovsk); and areas of decline in mining (Mangistau region).
The impact on water sources has decreased due to positive trends in the reduction of irrigated land in the southern regions (the highest level of reduction in water intake was observed in the Almaty region. The reduction amounted to more than 3,682 million m3, almost 54 %. Energy regions (Karaganda and Pavlodar regions) are in second place in terms of reducing the load on the water basin as a result of the recycling water supply introduction. On the third place there are irrigated lands of the Center and the North, where in generalthe share of irrigated lands was much less and significantly decreased in recent years, which caused a reduction in water intake (in Akmola region the reduction was by 12 times, in Kostanay region by 4 times).
An impact on land resources analysis showed an increase in impact in 4 types of areas: agglomerations of large cities; industrial centers with the growth of production capacities (Karaganda region, Pavlodar region); new oil centers of the West; areas of hazardous wastes from agriculture and industry (Nauyrzym district of Kostanay region). The decrease in impact was typical for old industrial centers, including the Rudny Altai and areas of declining mining (Mangistau region, a number of districts of the Karaganda region).
In the field of radiation exposure, there is a general trend of reduction due to natural purification in the absence of large new sources; there is a decrease in the impact in the zone of the Semipalatinsk nuclear test site (regions of the East Kazakhstan region), abrupt changes are impossible in the considered period of time. The hypothesis of an increase in impact with an increase in uranium production (Sozak district of the South Kazakhstan region) and Stepnogorsk city of the Akmola region is not confirmed.
The agricultural impact on the environment
The agricultural impact on the environment in the regions of Kazakhstan is defined, first of all, by the agrarian specialization and the intensity of agricultural production. However, the regions of Kazakhstan are strongly polarized since the majority of regions are developing extensively, but the types of intensive and suburban agricultural complex are presented as well.
The territorial structure of the agrarian complex changed considerably during the transition period, there were both interregional and intraregional shifts along the “North–South” axis, that is, dependent on the natural potential, along the “centre–periphery” axis, shifting loading to the central cities [15, 16]. As a result, since the AI was generally reducing, the loading was redistributed considerably.
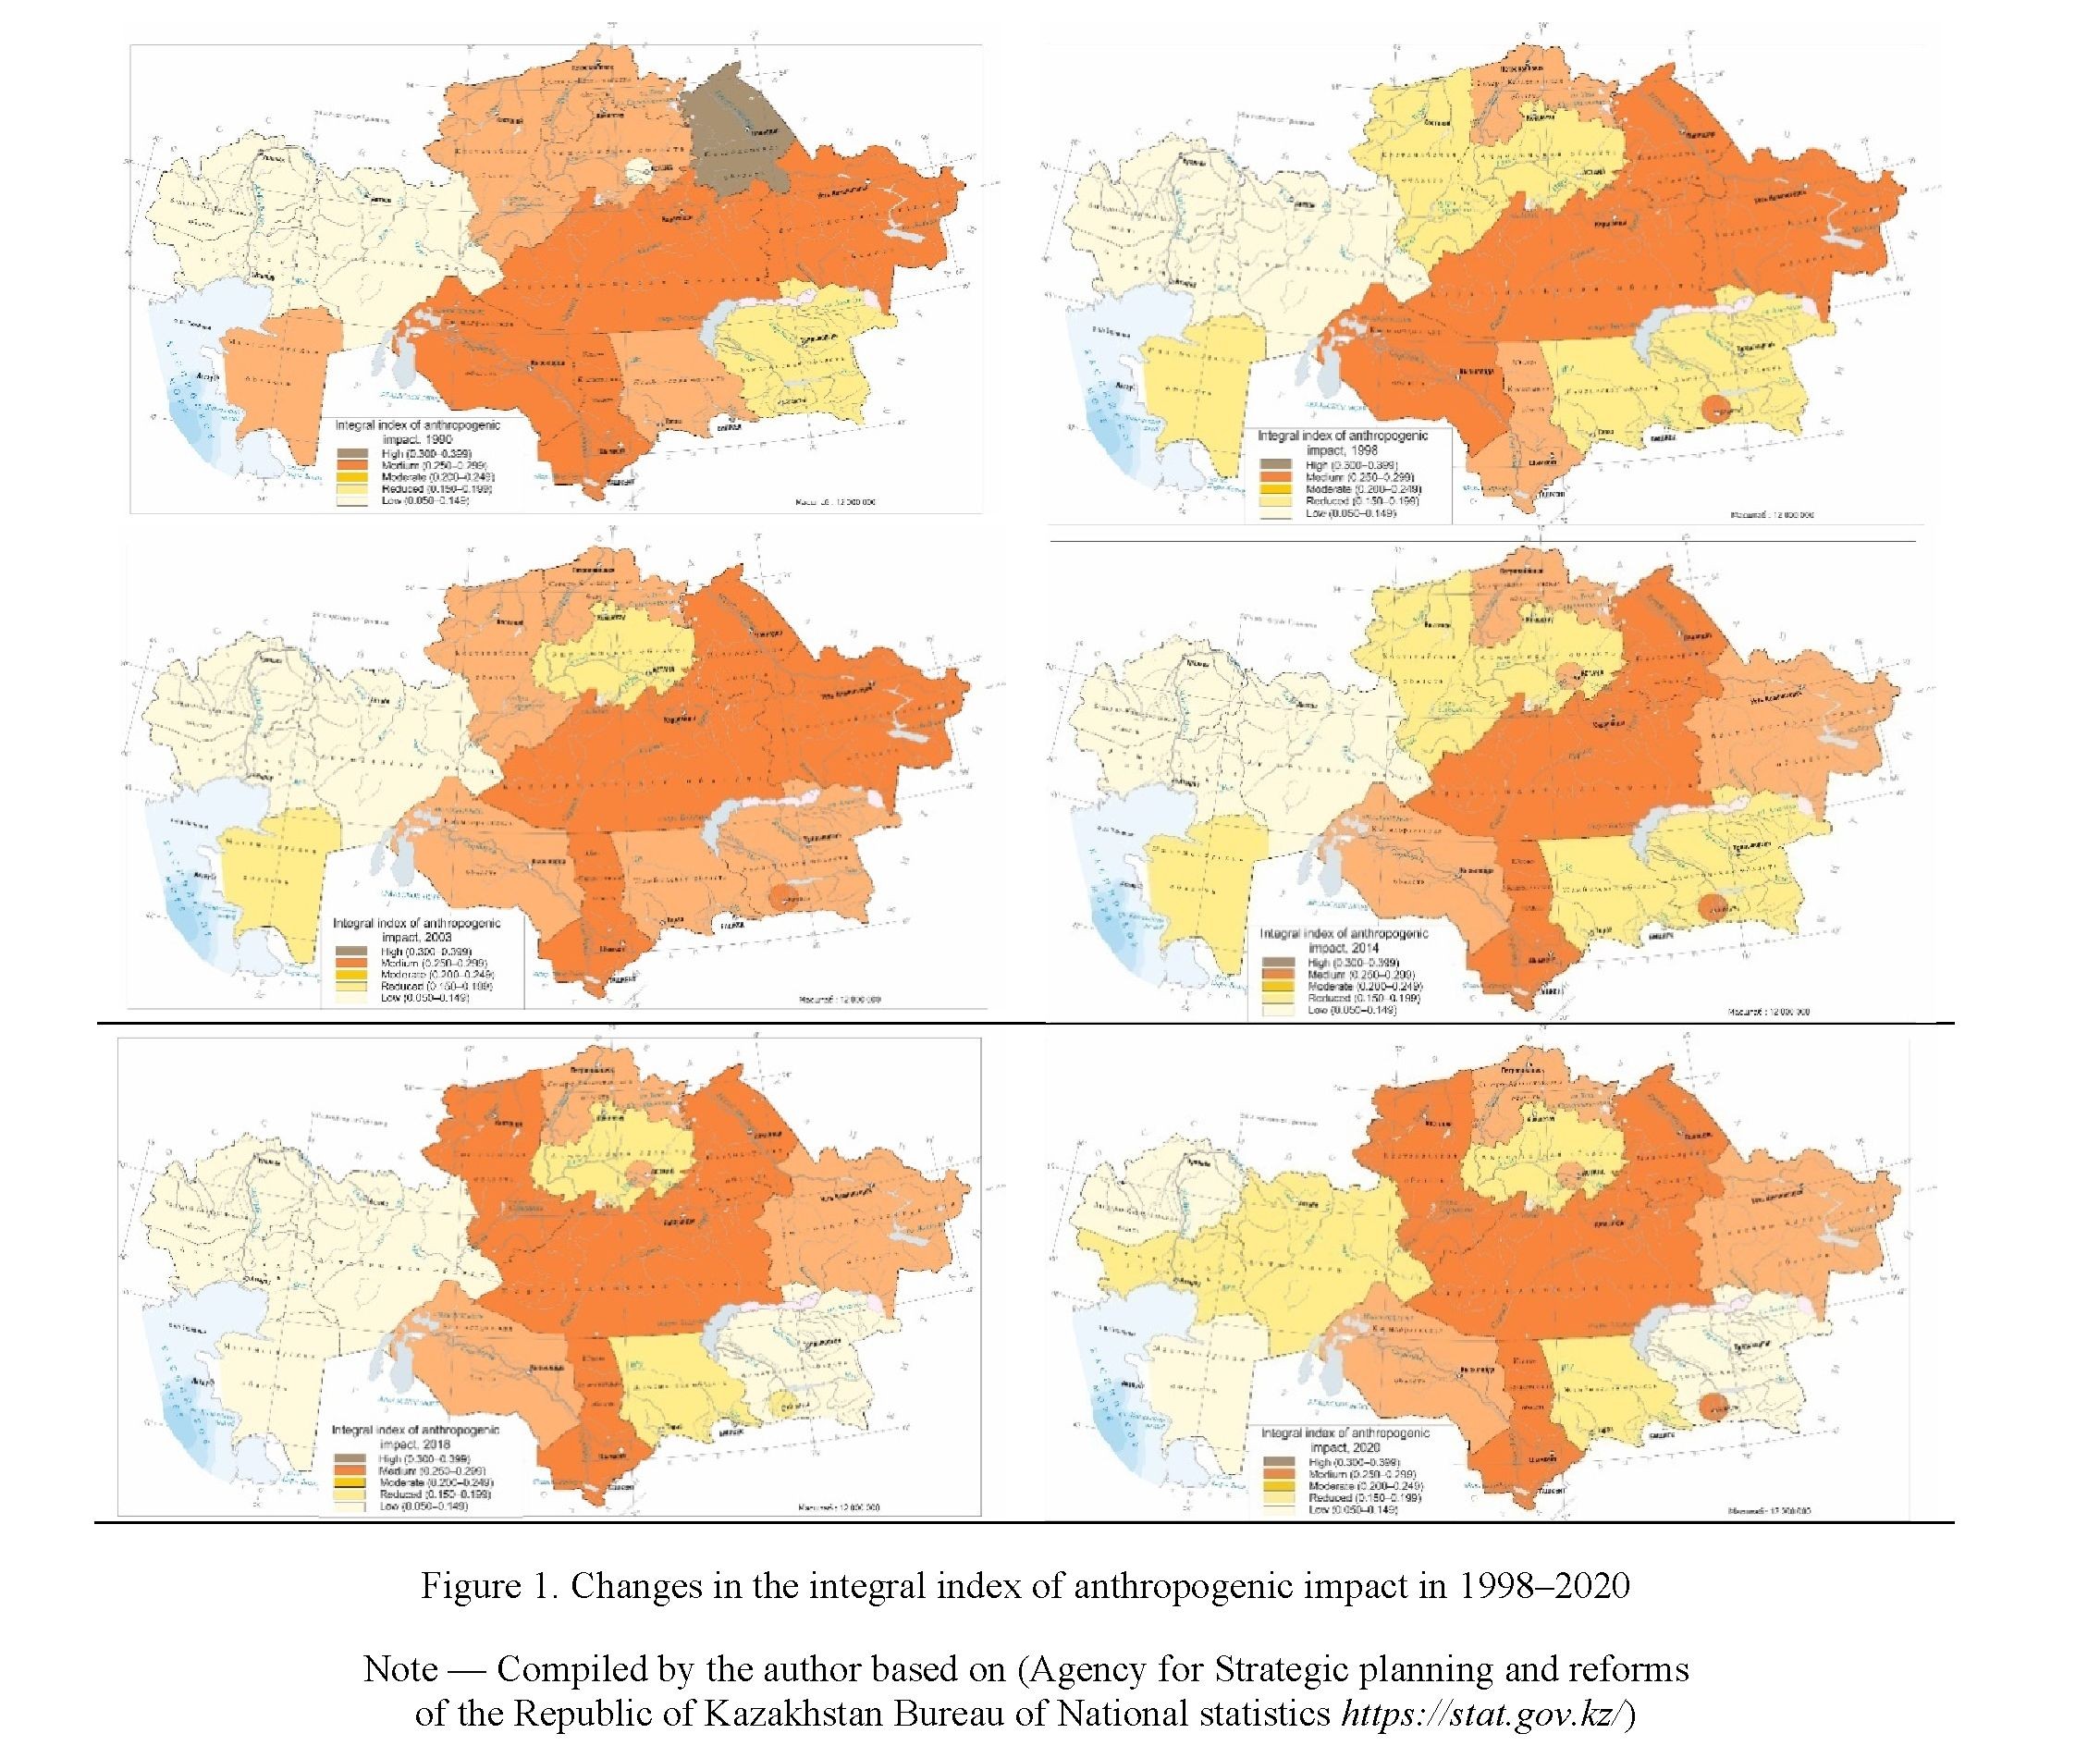
 An almost overall decrease in impact of agriculture during 1990–1998 was replaced by its growth in several regions, not always specializing in agriculture, in 1998–2008 and then by an almost overall growth in recent years that is connected both to the boosting agricultural production and its growing intensity. Therefore, the two leading groups (with a very high and high impact of agriculture) incorporate regions with different types of production growth (2020 as compared to 2008). Kazakhstan has only one leader, the Jambyl region, and two regions in the second group, the South Kazakhstan and Kyzylorda regions (Fig. 2). The intensity of AI grew by 20–100 % in all leading regions during 2010–2020.
The moderate impact of agriculture characterizes areas of North Kazakhstan and Almaty regions. Most regions of this type have also witnessed AI growth in recent years. Lowered, low and constantly lowering AI level is typical of the majority of regions of Kazakhstan.
The highest rates of AI in the Republic of Kazakhstan are characteristic of two groups of regions. The first group comprises western and northern districts of the Akmola region, northern districts of the Kostanay region and a number of districts of the North Kazakhstan region in the north of Kazakhstan. They have the largest area of the reclaimed lands (up to 90 %), however the agricultural industry is insufficiently intensified. It is mainly fields under cereal crops, most of them belong to agroholdings and large farms where pesticides are scantily used, and the volume of fertilizers is small. The second group includes southern districts of the Jambyl and South Kazakhstan regions, eastern districts of the Kyzylorda region and a number of districts of the Almaty region. High AI rates here are connected with the maximum share of irrigated lands and water consumption in agricultural industry, application of fertilizers and pesticides on the irrigated fields where vegetables, cotton and cucurbits are grown.
It is possible to identify certain zones of impact concentration based on impact of agriculture. Initially they were attributable to the natural environment conditions. The sub-regional level in Kazakhstan demonstrates that the loading is allocated more evenly in the northern regions and still covers large areas, shaping the ecological situation in the regions. On the contrary, the southern regions with a higher AI bigger level are mosaic due to the specialization of territories and, as a result, various resource intensity and volumes of waste.
Structural shifts in national economy, emergence of vertical agroholdings owning areas comparable to the area of some European countries led to serious changes in the structure of agricultural production. For the last 20 years, since 2000 the greatest gain in agricultural production was typical of the Pavlodar and South Kazakhstan regions in Kazakhstan (a gain of 120 %).
The comparative analysis of the rate of change in agriculture in reference prices and the AI integral index provided for several scenarios:
– Environmentally extensive development is characteristic of the majority of regions (65 %) where the growth in agricultural production increased the impact of the agrarian complex. These are the regions with the share of agriculture in GRP of about 20 % (Jambyl, South Kazakhstan). Their fast growth rates are generally ensured through production intensification in individual farms and large agroholdings.
The increase in agricultural production by 7–100 % led to a proportional growth of impact in some regions with a less intensively developing agrarian complex (North Kazakhstan, East Kazakhstan). The share of agricultural industry in these regions is 5–15 %. The majority of indicators defining AI either increased slightly (volume of mineral fertilizers) or decreased (volume of organic fertilizers, pesticides) during the considered period.
– Environmentally balanced development, when the increase in agricultural production is combined with the reduction of impact, was observed in the regions of North and West Kazakhstan (West Kazakhstan, Atyrau, Pavlodar, Kostanay regions). Their share of agricultural industry in GRP is only 1–6 % and is decreasing. Production growth in some of the regions is explained by the effect of a low base, AI indicators are low, perhaps some impact is just underestimated in this group of extensively developing regions: despite the considerable ploughing the degree of erodibility is not considered. In this case it would be better to discuss not the quality of growth, but the underestimation of ecological consequences of extensive development.
In general, the factor of production growth remains the leader in the formation of ecological impact of the agrarian complex. The script of environmentally balanced development is based rather on the defects of relative indicators in the regions far from agrarian specialization. The trend when with a growth of intensification, the loading is growing twice more slowly than production appears to be the most positive scenario.
Despite considerable economic shifts and transition to a new type of economy, the inherited factors still play a crucial role in the ranking of regions. Almost all regions with a very high level of anthropogenic impact have large industries since the USSR that determine specialization of the region.
Environmental rankings of regions based on the complex index are an efficient way of determining the priorities of environmental policy. The integral index provides new insights into the complexity and versatility of the environmental conditions. But a clear understanding of calculation specifics of the complex indicator is necessary to make the ranking a convenient decision-making tool in terms of environmental control and environmental management. The selected AI measurement technique considerably affects the outcome. It is important to use AI density for large countries with isolated intense sources of impact and extensive unaffected territories. Moreover, Kazakhstan that has experienced essential changes of agricultural areas (arable lands, pastures have reduced in the regions by 30–50 %) and urban lands during the land reform has the territorial structure of the intensity integral index considerably changed towards increase since 2003, while the indices for 1990 and 1998 prove to be underestimated.
Correlation between changes in IAI and dynamics of economic indicators
The dependence of GDP growth in Kazakhstan on industrial growth is still strong (the correlation coefficient is 0.95), but the dependence of pollution indicators on GDP is gradually decreasing. In 2000, a “decoupling” effect appeared, when emissions and sinks increased many times more slowly than industrial production.
Structural shifts in industry, assessed by the indicator of changes in the heavy industries share as a factor in the atmospheric pollution dynamics, naturally showed that countries with the least heavy industrial structure (Moldova, Belarus) reduced the amount of emissions into the atmosphere to the maximum. At the same time, the share of heavy industries itself remains constant because of the development in all countries with hydrocarbon resources, their active production. However, the decoupling coefficient, on the contrary, shows that the development of the industry in Russia and Kazakhstan, with more modern technologies introduction, in particular, the utilization of associated petroleum gas, leads to a more environmentally friendly development of both the industry and its regions of deployment (Tab. 2).
Table 2
Assessment of the structural shifts in the industry impact on changes in the emissions volume into the atmosphere in the EAEU countries 2005–2020
|
EAEU countries |
Air Emissions Index 2005=100 % |
The average value of the share of heavy industries, % |
Heavy industry share index, 2005=100 % |
Decoupling index, Dt |
|
Armenia |
22,2 |
50,9 |
82,9 |
-0,21 |
|
Belarus |
39,3 |
14,5 |
52,0 |
-0,01 |
|
Kazakhstan |
54,9 |
77,4 |
97,0 |
0,29 |
|
Kyrgyzstan |
33,5 |
67,1 |
92,6 |
-0,15 |
|
Moldova |
4,7 |
12,7 |
90,9 |
0,30 |
|
Russia |
55,0 |
45,3 |
87,9 |
0,28 |
|
Note –– Compiled by the author based on (Interstate Statistical Committee of the Commonwealth of Independent States, http://new.cisstat.org/web/eng Interstate) |
||||
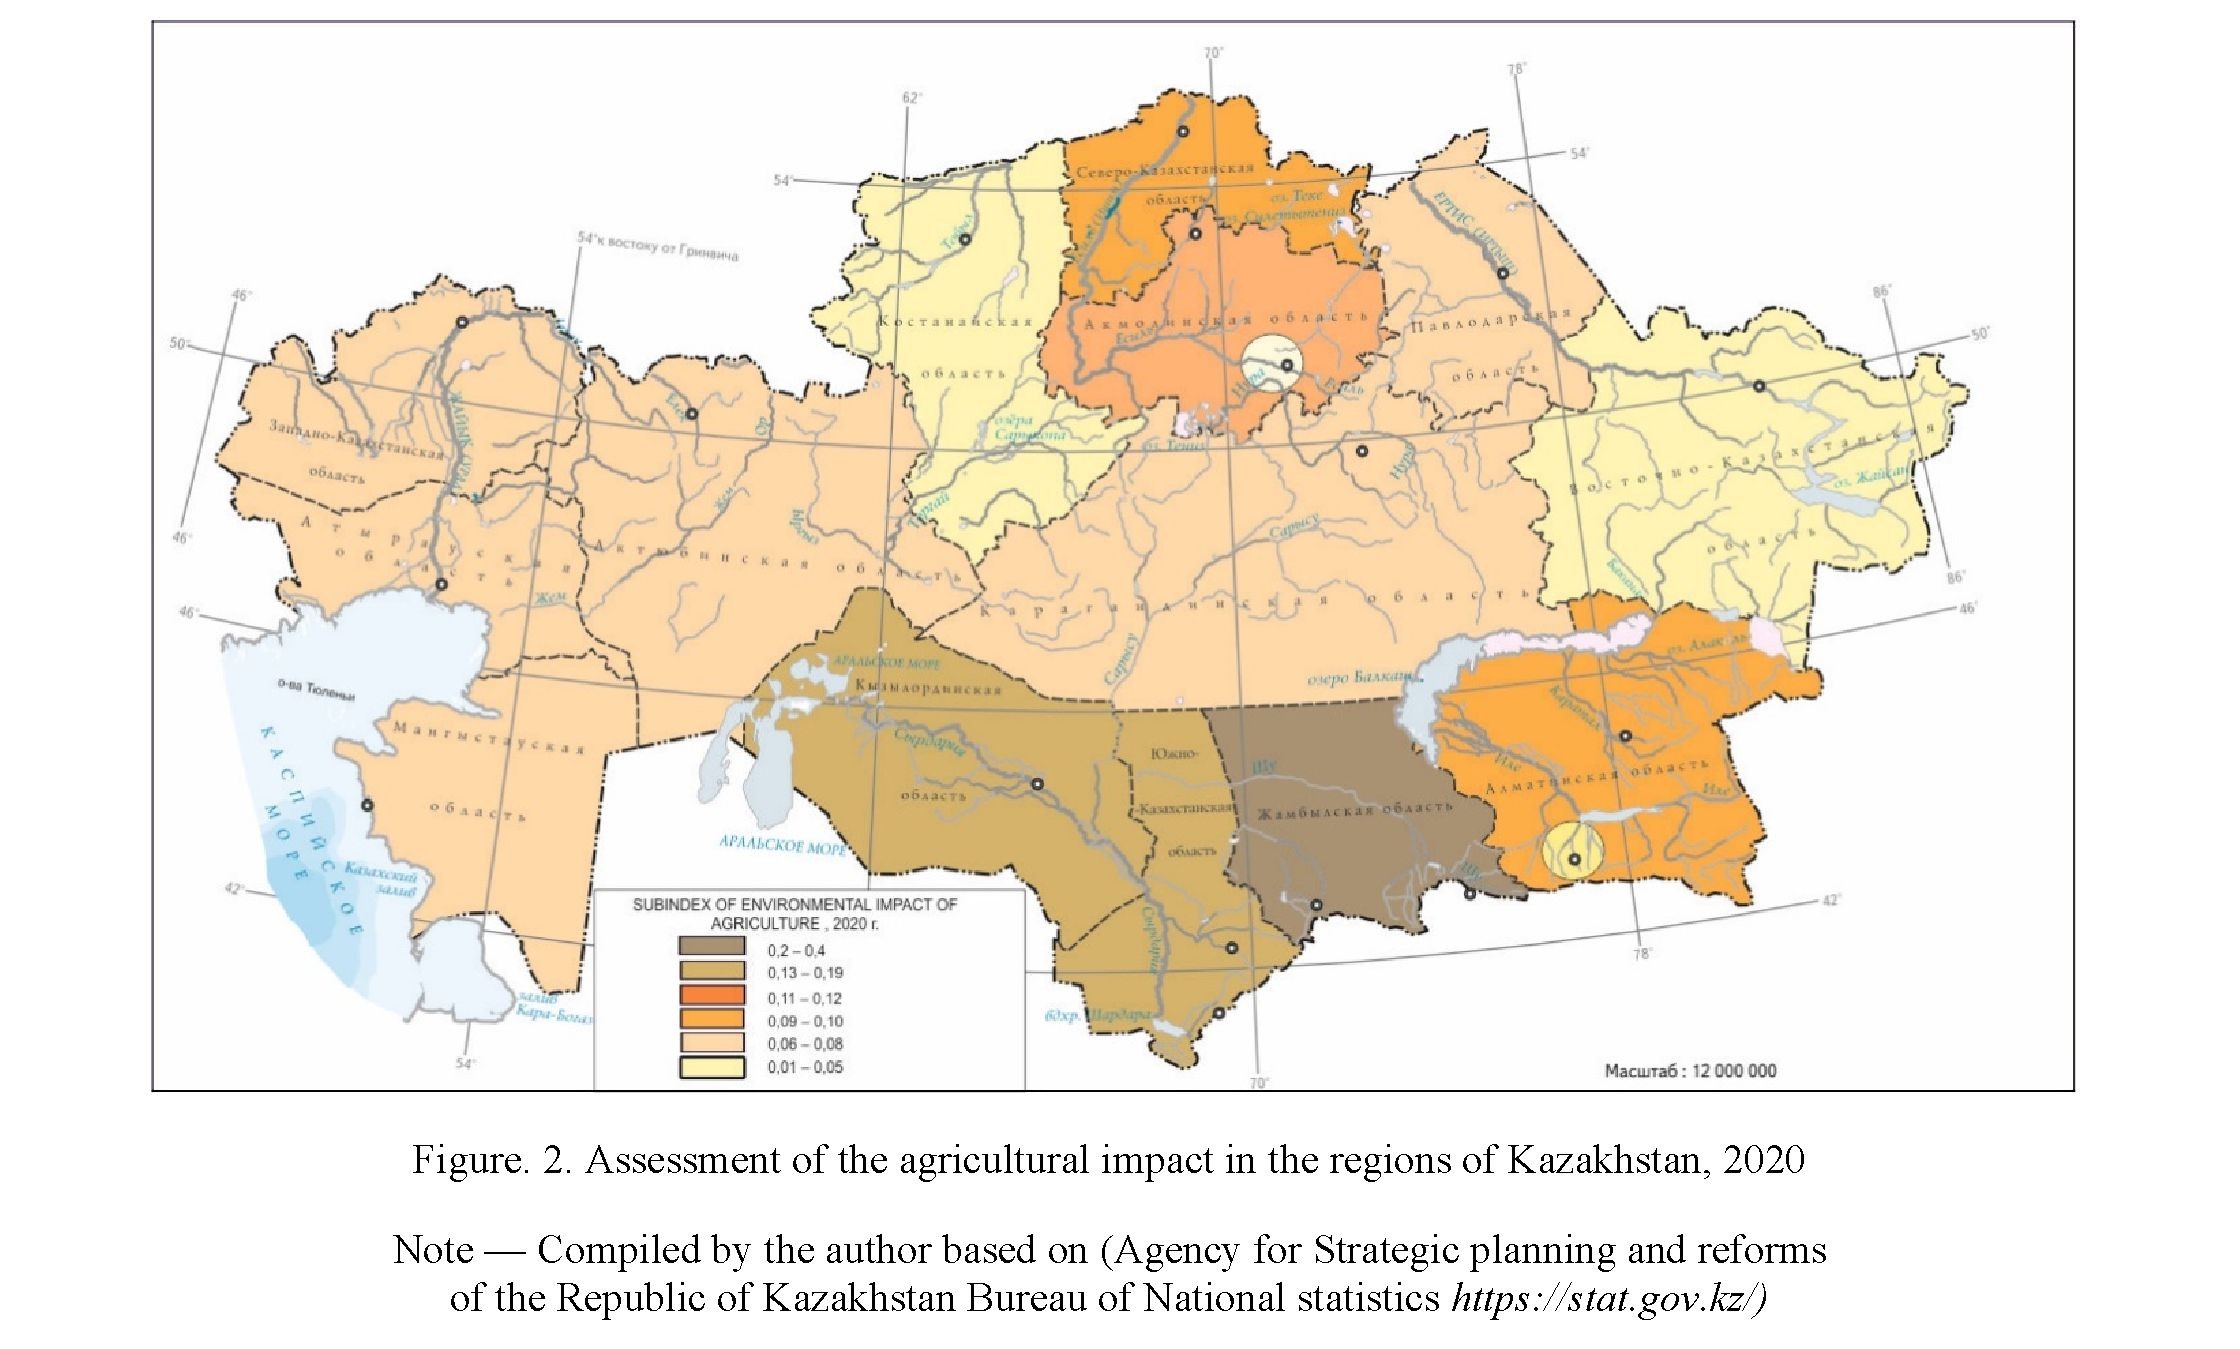
The scenarios for a change in IAI with respect to GRP have in terms of space a greater mosaic pattern than for individual indicators; the structural dependence coefficients show hardly any dependence. The maximum level of dependence was observed during the crisis period of 1991–1998. In almost all regions, the IAI decreased, but in oil and most depressed regions, it increased; as a result, a degradation scenario developed.
During the 2008–2009 crises, the IAI continued to decline in half the regions, forming a mosaic pattern of different scenarios. The greatest decrease was in the volumes of emissions and AI on water sources, forests, and agricultural load. In the regions dominated by the mining industry in the structure of sources of impact, the IAI continued to increase with decreasing GRP (Fig. 3).
In contrast to air pollution and, to a lesser extent, surface water pollution, the IAI index demonstrates a significantly lower dependence on the dynamics of GRP and industrial production. However, particular indicators also do not correlate with GDP or industrial production: in general, for 1990–2020, a statistically significant correlation coefficient is observed only with the volume of polluted wastewater in industry. However, in 1990–1998, most of the environmental load indicators (except for the volume of toxic waste) are characterized by a high degree of dependence. During the 1999–2008 economic growth period a high correlation was preserved for the volume of emissions and polluted wastewater in industry, and after 2008, for the volume of polluted wastewater and waste.
In the early 2000s, when growth rates were at their highest, GRP increased in all regions. However, most regions also increased the level of pollution during this period. Decrease in IAI with an increase in GRP was observed only in Pavlodar, North Kazakhstan and East Kazakhstan regions as a result of reduced pollution. Astana's rapid growth has also not been accompanied by an increase in pollution.
163
The largest number of regions developing according to the balanced scenario is typical for the period of stable economic growth in the 2010s, when most regions of northern and central Kazakhstan continued to reduce the impact level. However, since not all enterprises underwent modernization, the energy sector in these regions retained coal as a fuel, economic growth slowed down, and the regions returned to an extensive development scenario. In addition, the 2020 crisis linked to the COVID–19 pandemic slowed economic growth while maintaining pollution. As a result, the southern and western regions developed according to a depressive and even degradation scenario.
Conclusions
The integral index showed that in the post-Soviet period, inherited environmental problems and new sources of impact determined the spatial shift of anthropogenic impact at the regional level from the North and East to the South and West. Industry is losing its status as the main source of AI- densely populated areas and the increase in associated impact indicators have caught up with industry. The outflow of the population in Northern Kazakhstan has a positive effect on the level of AI and increases AI in Southern Kazakhstan. By 1991, a «framework» of regions with the highest anthropogenic impact level was formed in the Republic of Kazakhstan, which included the Central-Eastern part of Kazakhstan (Pavlodar, East Kazakhstan and the north of Karaganda region) and the North (with a lower anthropogenic impact level). Nevertheless, in subsequent years, there was a shift in anthropogenic impact in two directions:
– Southern direction. An anthropogenic impact growth was associated with a sharp increase in the population and, accordingly, an increase in population density, the level of motorization, household waste, and in rural areas such as an increase in the area of irrigated land and water intake;
– Western direction. The growth of anthropogenic impact was associated with an increase in oil production — especially in the Atyrau region, and, accordingly, there was an increase in emissions into the atmosphere, changes in the toxicity of emissions, the area of disturbed lands, etc.
Key factors maintaining territorial structure of AI areas in Kazakhstan:
- Inherited development. The largest AI centres in the territorial structure are still the regions where the industrial base was developed and formed back in the Soviet period: Pavlodar and Karaganda regions. Despite low efficiency and insignificant economic feasibility related to production and extraction of some minerals, a number of large enterprises, seriously harming the environment, continue to exist. It is all the fault of
Серия «Биология. Медицина. География». № 2(106)/2022
the existing structure of population settlement (miner's towns) and impossibility to move people from depressive monotowns.
The influence of the inherited factors is clearly demonstrated in the following areas:
- energy intensity of the leading industries combined with the structure of fuel balance in power industry and housing and public utilities in the eastern part of the country. The greatest energy intensity is still typical of large industrial regions with a high level of environmental stress, and of the most environmentally safe regions generally because of the increased coal consumption by municipal services;
- industrial specialization, age and quality of assets. The institutional environment and the policy of companies define the extent of asset modernization; the velocity and sometimes the direction of the process vary. The industrial impact is decreasing, most rapidly in the oil sector, but the industry remains a leading and most dynamic factor influencing the ecological status;
- accumulated radiation pollution is a specific factor in a number of regions, but its role is gradually decreasing.
- Institutional factor. Despite the stated models of the free market and general privatization, only few foreign companies could establish full control over large industrial enterprises which has contributed to the stability of the territorial structure of AI areas.
Factors influencing transformation of AI territorial structure:
- Becoming part of the global resource market. Soaring hydrocarbon prices have caused active development of oil and gas fields in the Western regions of Kazakhstan. It created new AI centres in the Western Kazakhstan: increase in oil production of the Atyrau region from 2.5 million tons in 1990 up to 31.9 million tons in 2014, development of the Karachaganak oil and gas field in the West Kazakhstan region caused increase in oil production from 4 million tons in 1990 to 13 million tons in 2014.
- Institutional factor. Emergence of the western companies in mining and manufacturing industry of Kazakhstan has reduced the level of environmental impact in terms of specific indicators, for example, Kazakhstan has emissions almost twice less than Russia per unit of oil produced. It influences the territorial structure of pollution areas: new industrial centres in Kazakhstan are less significant on a national scale than in Russia (based on relative measures).
- State environmental policy.
- Reaching the limit of ecological capacity in some regions. Most of regions in Kazakhstan are located within semi-arid and arid zones where ecological limits of water sources, pastures and arable lands are almost reached. When using relative measures, the Mangystau and South Kazakhstan regions demonstrate high specific rates of anthropogenic impact on limited water sources and land resources. Therefore, any minimum increase of anthropogenic impact in regions with ecological capacity close to its limits leads to a serious degradation of the environment.
- Demographic changes as a factor transforming the territorial structure of anthropogenic impact are typical of Kazakhstan that has AI increasing in the South due to population growth and falling in the North due to depopulation.
Therefore, integral assessment of environmental conditions in the regions of Kazakhstan has revealed — the solution to modern environmental problems lies in a compromise between the demand for an intense economic development and the need for environment protection. Despite considerable positive changes in the national environmental policy, advance economic development regions possessing competitive advantages still tend to have a high AI level.
Acknowledgements
The work was supported by the research work “Current dynamics and factors of socio-economic development of regions and cities of Russia and neighbouring countries”
References
- Decoupling natural resource use and environmental impacts from economic growth. UNEP, 2011.
- Dixon J. Promoting Market-oriented Ecological Compensation Mechanisms: Payment for Ecosystem Services in China / J. Dixon, X. Jian // World Bank. Washington DC, 2009.
- Green Growth. Strategy Interim Report: Implementing Our Commitment for a Sustainable Future. Paris, OECD, 2010.
- Scandinavian Destination. Sustainability Index. Assessing and reporting on the sustainability performance of Scandinavian major meetings destinations. — Scandinavian Chapter of the International Congress and Convention Association (ICCA), MCI Sustainable Services, 2012.
- Sustainable Cities Index. Balancing the economic, social and environmental needs of the world’s leading cities. Arcadis, 2015.
- The Ecological Footprint Atlas. Brad Ewing, Steven Goldfinger, Mathis Wackernagel, 2008.
- National Civic Review. Wiley Periodicals, Inc., A Wiley Company // Special Issue: Twenty-Five Years of Healthy Communities: Part 1. Winter. — 2013. — Vol. 102 (4). — P. 3–78.
- Sino-Singapore Tianjin Eco-City. A Case Study of an Emerging Eco-City in China (Technical Assistance (TA) Report). The World Bank, AusAID, November 2009.
- The Green City Index. A research project conducted by the Economist Intelligence Unit, sponsored by Siemens. Siemens AG Corporate Communications and Government Affairs, Munich, Germany, 2012.
- Битюкова В.Р. Методы комплексной оценки региональных различий экологической напряженности в России / В.Р. Битюкова, П.Л. Кириллов // Региональные исследования. — 2011. — № 2 (32). — С. 56–69.
- Environment Protection and Sustainable Development in Kazakhstan. Committee on Statistics. Astana/Almaty, 1995–2020.
- Bityukova V.R. Assessing the Ecological Status in Regions of Russia and Neighbouring Countries. Current Trends in Landscape Research / V.R. Bityukova // Innovations in Landscape Research. Cham. — 2019. — P. 455–466.
- Nagvi A. Fifty shades of green: Revisiting decoupling by economic sector and air pollutants / A. Nagvi, K. Zwickl // Ecological Economics. — 2017. — Vol. 133. — P. 111–126.
- Bityukova V.R. (2021). Regional Projection of Environmental Consequences of Crises in the Russian Economy / V.R. Bityukova // Regional Research of Russia. — 2021. — Vol. 11 (4). — P. 656–666.
- Нефедова Т.Г. Десять актуальных вопросов о сельской России: ответы географа / Т.Г. Нефедова. — М.: Ленанд, 2021. — 456 с.
- Umbetpaev A.T. Sanitary problems of combined pesticide impact / A.T. Umbetpaev // International Journal on Immunorehabilitation. — 2009. — Vol. 11 (1). — P. 152–157.