Abstract
Object: Purpose of this paper is to identify and assess the impact of non-standard employment on the income of the population in Kazakhstan.
Methods: For this study, we used methods of statistical multiple correlation and regression analysis based on the software package “Data Analysis” offered by MS Excel. We used data from the official website of the Bureau of National Statistics of the Agency for Strategic Planning and Reforms of the RK at stat.gov.kz.
Findings: We have performed a preliminary selection of statistical indicators and determined a group of factors (and corresponding indicators) that hypothetically affect the population income for the period of 2004–2018. We have highlighted a total of twelve factors significantly affecting the income and grouped them into four groups: employment and income indicators, demographic and social indicators.
Based on the selection of the most significant factors, we have constructed a regression equation that demonstrates the degree of influence on the resulting income indicator. Subsequently, we have assessed the obtained regression model. The regression equation found is significant by the Fisher criterion; all its parameters, including the intercept term, are significant by the Student's criterion with a maximum error of 0.049. Autocorrelation of the residues is non-existent (according to the Durbin-Watson criterion). The multiple correlation coefficient is 0.99.
The results obtained can be useful for assessing the effectiveness of various social policy instruments, both at regional and national levels.
Conclusions: Indicators of employment, average wages, and social benefits occupy an important place in the system of indicators of average per capita income. The analysis shows a strong positive relationship between these indicators. At the same time, the overall relationship between changes in indicators of non-standard employment and population incomes in the Republic of Kazakhstan appears to be important for a more adequate analysis of the situation. A negative correlation between indicators of non-standard employment and per capita income confirms the vulnerability and instability of non-standard employee labor relations, and receiving a lower income compared to standard employment.
An individual's income is the main source of resources for meeting their most important needs, which ultimately has a decisive impact on the level of household well-being. In this regard, identification of factors affecting both increase or decrease in income is an important subject of research at all times.
In the past few decades, non-standard employment has become a stable feature of the worldwide labor market. Although entrepreneurs use non-standard employment as a tool to increase business competitiveness, on the part of the employee, non-standard employment is often associated with lower incomes and social security levels, unsatisfactory working conditions, especially when these employment forms are used by employers solely for the purpose of avoiding their duties. (Pritvorova, Simonov, Atabayeva, 2020).
People who find themselves in a situation of unstable employment lose the opportunity to plan their budget for a long time, which has negative consequences not only for the individual himself, but also for the development of society as a whole (Shelomentseva, Bespalyy, Beisembayeva, Soltangazinov, 2019).
In our study, we quantify the impact of non-standard forms of employment on average per capita income in households of Kazakhstan.
Identifying and assessing the impact of factors on household incomes is a classic area of economic research on living standards and well-being of the population (Sen, Sumner, Yusuf, 2020). The decline in the living standards causes a prolonged crisis, primarily in the social sphere: a decrease in the quality of education, an increase in unemployment and poverty. (Choi, Choe, Kang, 2020).
Considering income in the context of employment, the researcher Hong Zuo (2016) states that the main cause for rising income inequality is associated with the growth of non-standard employment and the increasing wage gap between its standard and non-standard forms.
With an increase in unemployment, the total income of the society decreases, wage growth stops resulting in a reduction in aggregate demand (Sovbetov, 2018, Hillman, 2020). Depressed demand undermines incentives for investment and employment leading to slower productivity growth and lower social welfare. These processes significantly exacerbate the issues of socio-economic inequality. In this regard, state policy requires constructive measures to improve the legal protection of employment, the labor market flexibility and the adoption of active employment programs (Vishnevskaya, Zudina, 2020).
The main research method is statistical multiple correlation and regression analysis.
The study involved the following tasks:
Determination of a group of indicators that have a hypothetically significant impact on the income of the population;
Selection of statistical data for the period of 2004—2018;
Identification of functional relationships between the considered dependent (y) and independent (x) variables included in the model; and
Verification of the constructed model.
Since the macroeconomic indicator “income” is determined by a large number of factors simultaneously affecting it, we chose the method of multiple regression analysis. This implies constructing a model (Formula 1) and investigating the dependence of the variable y on several independent variables x1, x2, ..., xn. The multiple regression equation has the following form:
y = a + b1x1 + … + bnxn (1)
where:
y is a dependent variable;
a is an intercept term;
b1...bn are regression coefficients; and
x1...xn are independent variables.
The intercept term a determines the value of y at zero values of all factor variables. Coefficients b1...bn at independent variables are interpreted as the average change in the dependent variable y with a single change in the independent variable itself and unchanged values of all other explanatory variables.
The null hypothesis is put forward that the regression coefficients are zero, that is, H0: b1 = b2 = ... = 0. If the hypothesis is confirmed, then the coefficients are not statistically significant.
- Selection of factors for building a model
For the first step, we have selected and analyzed macro indicators for the construction of a model under review for the period of 2004—2018.
Employment is a universal indicator associated with almost all types of macroeconomic indicators. In this regard, employment can serve as an explanatory indicator in relation to one of them, and as a result parameter in relation to others. In our study, all types of employment (standard and non-standard) are regression arguments. Since we are interested in how the model behaves in relation to non-standard employment, we assume an inverse relationship between income and all types of non-standard employment.
Evidently, to improve the dependence and obtain an adequate model, we need to include a sufficient number of variables in the regression equation. Since income is a complex indicator that considers the totality of socio-economic indicators, we shall add social indicators, unemployment and poverty indicators to the list of variables.
The first group consisted of indicators of non-standard employment, as they are the main object of the study. We have selected the following types of non-standard employment for their prevalence: temporary, part-time, self-employment, and informal employment.
The second group of factors under review included private income indicators: average wages and income from property.
The third group included a demographic indicator: the number of employed and unemployed people, which has a direct impact on the income level. As well as the level of youth unemployment and poverty (the share of people with incomes below the subsistence minimum).
The fourth group consisted of social payments: pensions, social transfers (benefits, targeted social assistance, housing assistance, and scholarships).
Thus, we have put forward a total of twelve indicators as independent variables (Table 1).
Table 1. Determination of model factors
|
Group |
Factor |
Name |
|
У |
Income used for consumption, on average per capita |
|
|
Group 1 |
Х1 |
Fixed-term contracts, thousand people |
|
Х2 |
Part-time employment, thousand people |
|
|
Х3 |
Self-employment, thousand people |
|
|
Х4 |
Informal employment, thousand people |
|
|
Group 2 |
Х5 |
Average salary, tenge |
|
Х6 |
Property income, % |
|
|
Group 3 |
Х7 |
Employed population, thousand people |
|
Х8 |
Unemployed population, thousand people |
|
|
Х9 |
Youth unemployment rate, % |
|
|
Х10 |
Poverty indicators, % |
|
|
Group 4 |
Х11 |
Average pension size, tenge |
|
Х12 |
Social transfers, % |
|
|
Note: Compiled by the authors |
||
- Checking multicollinearity
A multicollinearity, that is, the relationship between independent variables is a frequent issue when constructing multiple linear regression models using the least squares method. Its consequences can be quite serious:
High standard errors of estimates, which makes identification of true values of the determined quantities harder;
The accuracy of the coefficient estimation worsens; and/or
An incorrect sign for the regression coefficient and others may be obtained.
In this regard, a carefully check for multicollinearity factors and its elimination before building a model is required. For this purpose, a matrix of paired correlation coefficients is used (Table 2).
Table 2. Correlation matrix
|
У |
Х1 |
Х2 |
Х3 |
Х4 |
Х5 |
Х6 |
Х7 |
Х8 |
Х9 |
Х10 |
Х11 |
Х12 |
|
|
У |
1 |
||||||||||||
|
Х1 |
-0,22 |
1 |
|||||||||||
|
Х2 |
-0,97 |
0,31 |
1 |
||||||||||
|
Х3 |
-0,73 |
-0,08 |
0,80 |
1 |
|||||||||
|
Х4 |
-0,96 |
0,05 |
0,64 |
0,88 |
1 |
||||||||
|
Х5 |
0,99 |
-0,21 |
-0,67 |
-0,85 |
-0,66 |
1 |
|||||||
|
Х6 |
-0,67 |
0,57 |
0,76 |
0,31 |
0,56 |
-0,65 |
1 |
||||||
|
Х7 |
0,95 |
-0,46 |
-0,64 |
-0,62 |
-0,65 |
0,63 |
-0,81 |
1 |
|||||
|
Х8 |
-0,92 |
0,51 |
0,82 |
0,62 |
0,80 |
-0,91 |
0,84 |
-0,98 |
1 |
||||
|
Х9 |
-0,93 |
0,48 |
0,84 |
0,68 |
0,85 |
-0,94 |
0,80 |
-0,98 |
0,99 |
1 |
|||
|
Х10 |
-0,69 |
0,76 |
0,74 |
0,39 |
0,58 |
-0,73 |
0,69 |
-0,87 |
0,87 |
0,86 |
1 |
||
|
Х11 |
0,98 |
-0,13 |
-0,66 |
-0,86 |
-0,67 |
0,69 |
-0,62 |
0,61 |
-0,89 |
-0,92 |
-0,67 |
1 |
|
|
Х12 |
0,94 |
-0,01 |
-0,91 |
-0,88 |
-0,96 |
0,97 |
-0,50 |
0,85 |
-0,82 |
-0,85 |
-0,60 |
0,98 |
1 |
Note: Compiled by the authors based on data obtained using MS Excel
Tightness of the relationship between the effective feature and one of the factors when eliminating the influence of other factors included in the regression equation is characterized by the use of partial correlation coefficients. These indicators are used to determine whether a particular factor should be included in the model. A criterion for selecting factors is the value of a partial correlation coefficient which is 0.7 or greater. Factors that do not meet this condition are not included in the model.
So, to eliminate multicollinearity, we shall use the method of excluding variables, which consists in the fact that highly correlated independent variables (rxixj 0,7) are excluded from the model. In our study, such variables are X1, X3, X6, X8, X9, X10, and X12.
Also, using a partial correlation coefficient, we can rank indicators by the strength of their influence on the dependent variable (Table 3).
Table 3. Ranking factors
|
Factors |
Correlation coefficient value |
|
X5 Average salary |
0,99 |
|
X11 Average pension size |
0,98 |
|
X2 Part-time employment |
-0,97 |
|
X4 Informal employment |
-0,96 |
|
X7 Employed population |
0,95 |
|
X6 Social transfers |
0,94 |
|
X9 Youth unemployment rate |
-0,93 |
|
X8 Unemployed population |
-0,92 |
|
X3 Self-employment |
-0,73 |
|
X12 Poverty indicators |
-0,69 |
|
X11 Property income |
-0,67 |
|
X1 Fixed-term contracts |
-0,22 |
|
Note: Compiled by the authors |
|
Next, based on data obtained in Tables 2 and 3, we shall analyze an income’s relationship with the above indicator groups:
- To start with, we can confirm a noticeable inverse relationship between income and all types of nonstandard employment. Therefore, all correlation coefficients for non-standard employment swing around. This means that with the increase in the number of non-standard employees, the income decreases. Underemployment (-0.97) and informal employment (-0.96) have shown a high correlation with income used for consumption. Among all factors, temporary employment has the weakest impact on income (-0.22). Selfemployment has an average correlation (-0.73), but is not included in the model due to high multicollinearity with factors x2, X4, X5, X11, and X12. This suggests that it is self-employment that can often be characterized as incomplete and informal.
- The highest level of correlation is observed between average salary and income (0.99). A positive direct relationship suggests that with the growth in salaries, the average per capita income increases as well, i.e., salaries are the main source of income. Property income has a negative correlation (-0.67) and shall be excluded due to multicollinearity with variables x2, X7, X8, and X9.
- Employed population (0.95) has a positive correlation with income and is included in the model. Indicators of unemployment (-0.93, -0.92) and poverty (-0.69) correlate negatively with the income and are excluded from the model due to multicollinearity.
- Indicators of the fourth group of factors (the average pension size (0.98) and social transfers (0.94)) show a strong relationship with the average per capita income. However, due to multicollinearity, social transfers are excluded from the model as well.
Thus, to find a multiple regression, we have excluded the variables more interrelated with each other than with the effective feature. After eliminating multicollinearity, the remaining variables show the greatest correlation with the productive trait (per capita income). These are variables X2 (part-time employment, thousand people), X4 (informal employment, thousand people), X5 (average salary, tenge), X7 (employed population, thousand people) and X10 (average pension size, tenge).
- Construction of a model
Now we proceed to building a multiple regression (Table 4) using the “Data Analysis” tool included in MS Excel.
Table 4. Regression analysis log
|
Display of results |
||||
|
Regression statistics |
||||
|
Multiple R |
0,999 |
|||
|
R Square |
0,999 |
|||
|
Adjusted R Square |
0,998 |
|||
|
Standard Error |
690,811 |
|||
|
Observations |
15 |
|||
|
df |
SS |
MS |
F |
|
|
Regression |
5,00 |
2911041200,07 |
582208240,01 |
1220,00 |
|
Residual |
9,00 |
4294975,66 |
477219,52 |
|
|
Total |
14,00 |
2915336175,73 |
||
|
Coefficients |
Standard error |
t Statistics |
P Value |
|
|
Y-Interception |
41631,29 |
11068,309 |
3,761 |
0,004 |
|
X2 (Part-time employment, thousand people) |
-3,08 |
1,19 |
-2,587 |
0,044 |
|
X4 (Informal employment, thousand people) |
-1,42 |
0,580 |
-2,448 |
0,049 |
|
X5 (Average salary, tenge) |
0,19 |
0,050 |
3,812 |
0,003 |
|
X7 (Employed population, thousand people) |
5,76 |
1,389 |
4,145 |
0,003 |
|
X11 (Average pension size, tenge) |
0,23 |
0,09 |
2,545 |
0,045 |
Note: Compiled by the authors based on data obtained using MS Excel
31
Using the Durbin-Watson critical points distribution table, we obtain the lower (dL = 0.56) and upper (dU = 2.21) values of the criterion for m = 5 (number of independent variables) and n = 15 (number of observations). We then compare the obtained values with those calculated by Formula 2: DW = 2.01 > dL = 0.56, and so the Durbin-Watson statistic value close to two indicates the absence of autocorrelation.
Thus, the absence of autocorrelation confirms the effectiveness of the constructed model.
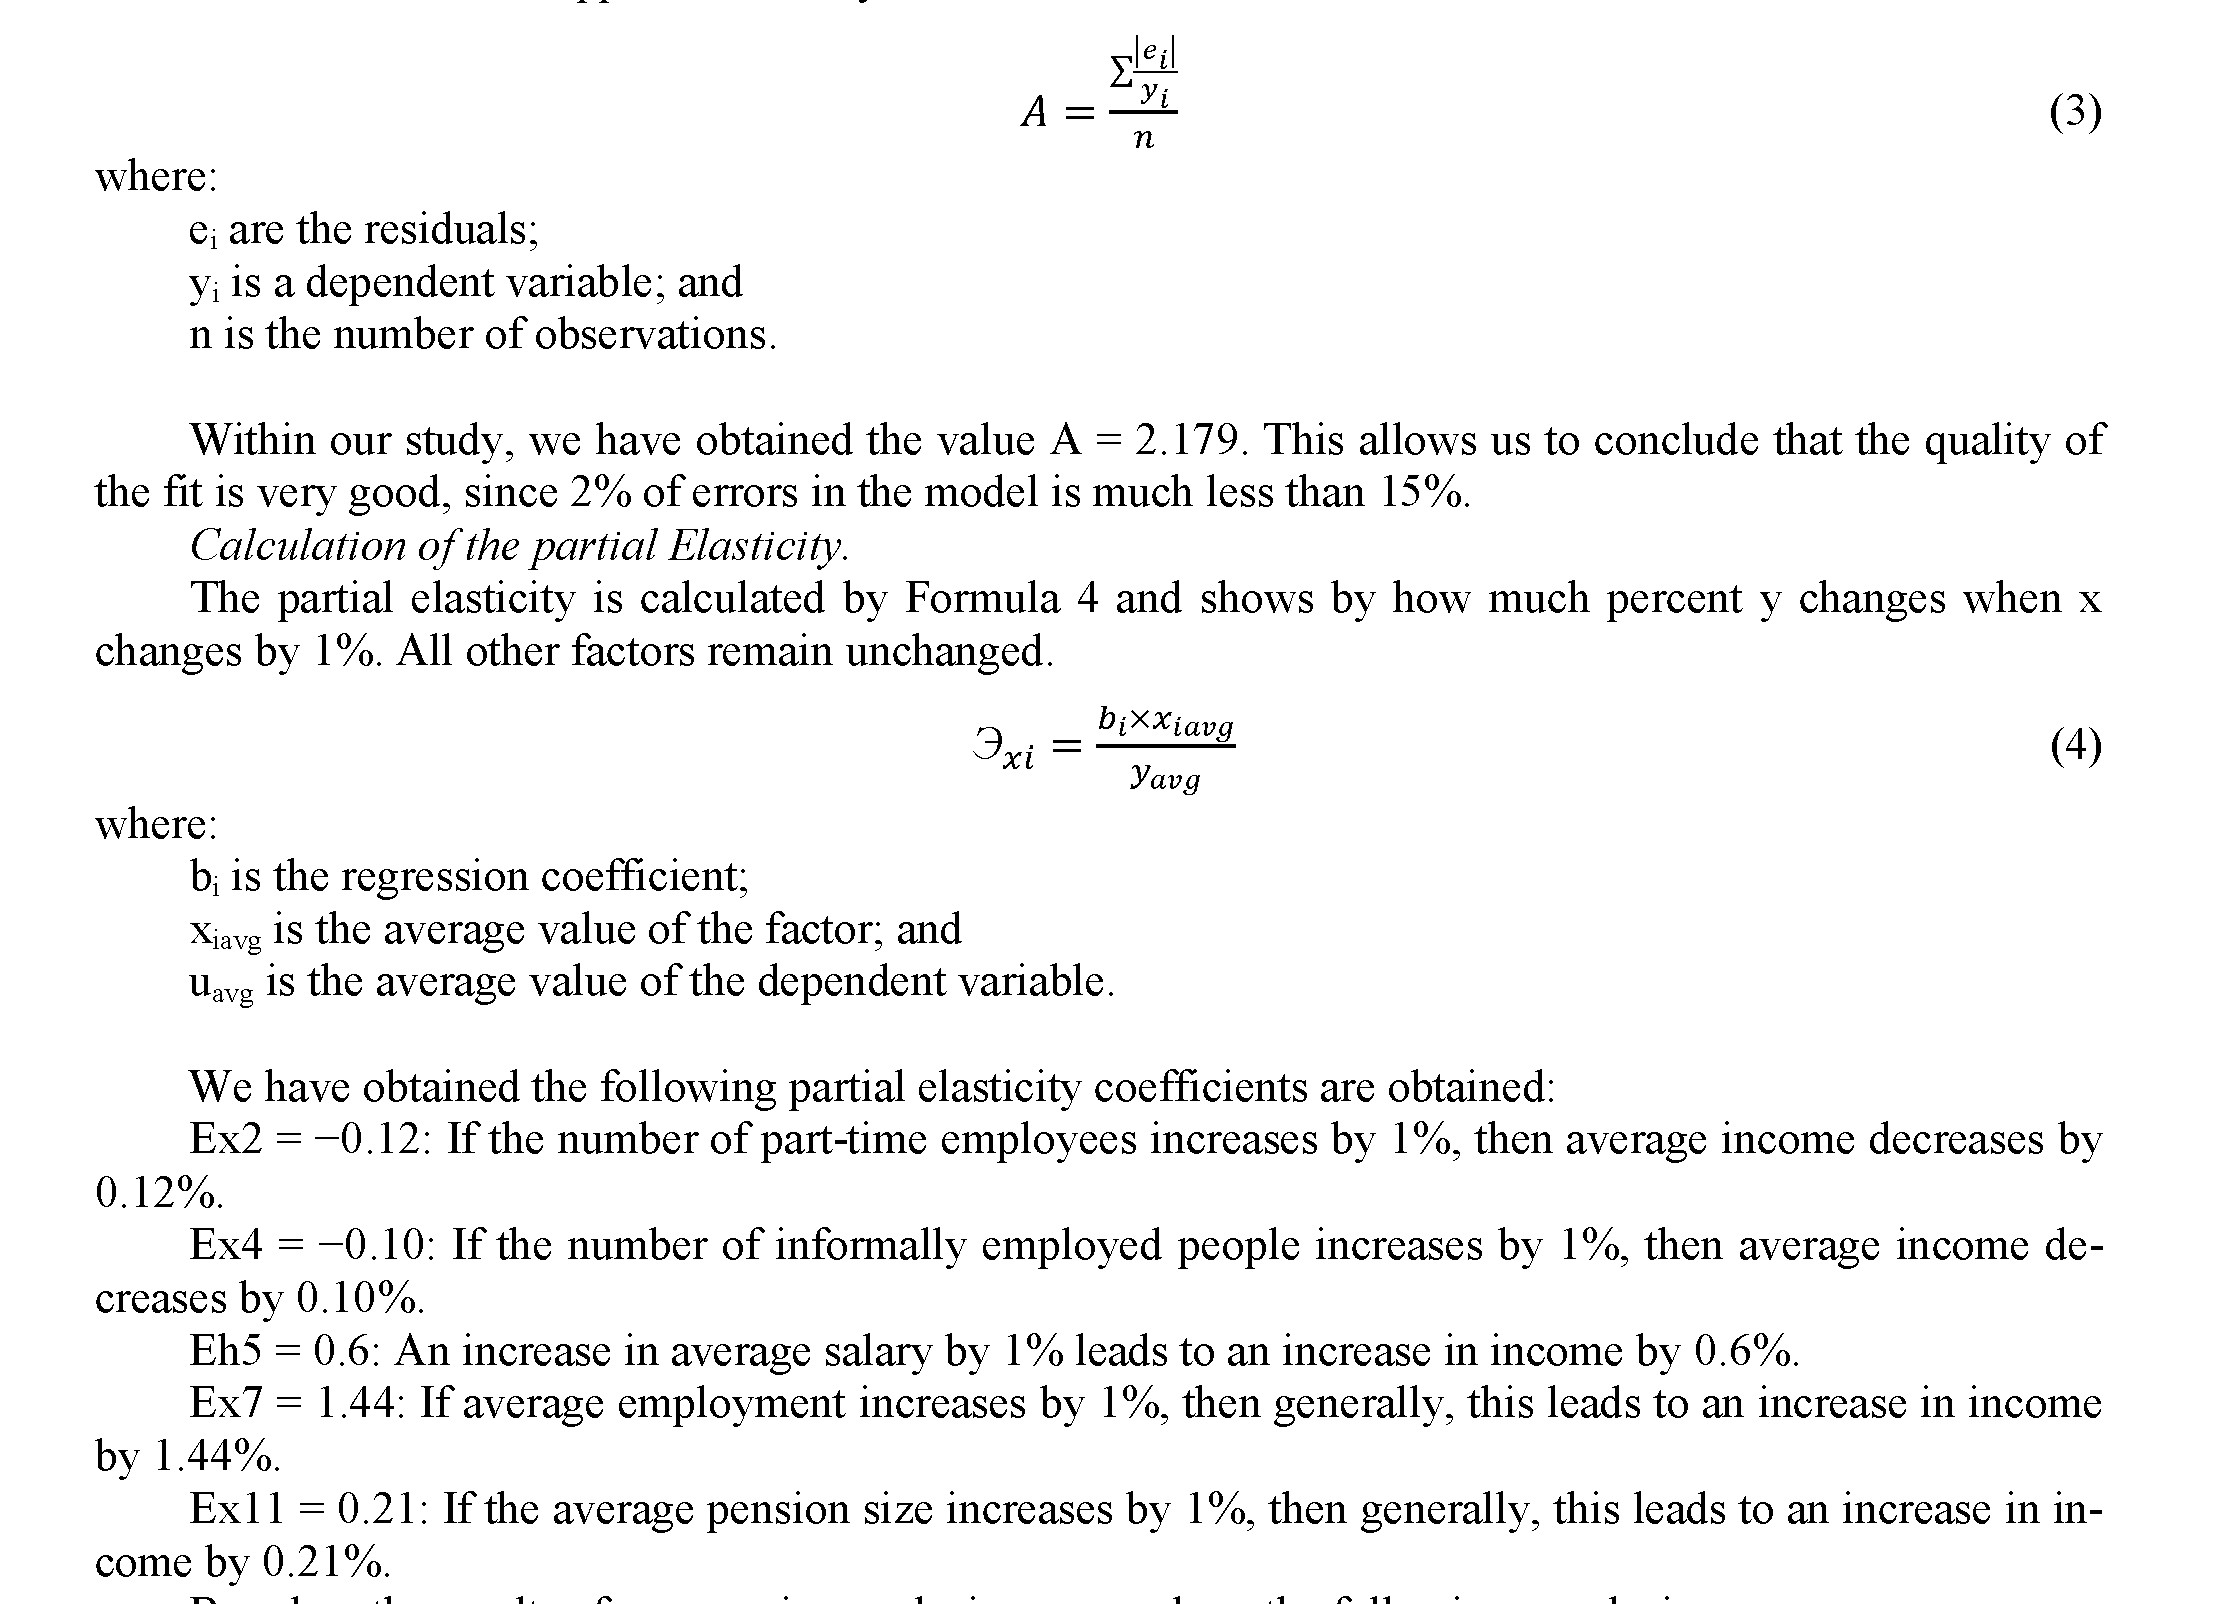
Calculation of the Approximation Error.
The permissible value of the approximation error should be within A ≤ 15%. If A > 15%, then the model is given a negative evaluation.
Let us calculate the approximation by Formula 3:
Based on the results of a regression analysis, we can draw the following conclusions:
- The multiple regression model we have constructed meets all quality criteria. The significance level of regressors is less than 0.05 (P Value), which suggests significance and reliability of the regression coefficients included in the model. A multiple correlation coefficient of 0.99 indicates that 99% of the model is explained by the factors included in it;
- Employment indicators play a fundamental role in increasing the level of per capita income and, as a consequence, the life of the population, which is confirmed by the calculated coefficient of elasticity and a high regression coefficient (b4 = 5.76);
- on-standard employment has an inverse relationship with the income. Declining trends in part-time and informal employment lead to higher incomes;
- The main source of improving the living standards is wages, the labor income, which simultaneously reflects the level of material needs of employees. Along with the growth in the rates of labor income in the Republic, there has been a steady growth in per capita aggregate income as one of the most important factors in raising the level and quality of life.
One of the key indicators in a market economy is indicators reflecting the income level (Estrada, Xuehui Han, Park, Tian, 2018). The performance of the current income policy can be judged by macroeconomic indicators: employment, wages, and pensions. The income indicator’s importance is explained by its relationship with various areas of state life (Chen, Xu, 2017).
Our data on the negative correlation between non-standard employment and income to some extent coincide with the results of a study by Swedish scientists Johansson Sevä and Larsson (2015). They argue that non-standard employment may not be equally beneficial for people in terms of their income compared to full-time employment. That is, non-standard employment workers may face a much higher risk of poverty than ordinary ones. That is correct; there is a negative impact, it is just the share in Kazakhstan is low, so the impact on elasticity is not that critical.
We endorse the statement of A.A. Taubayev, A.A. Legostayeva, G.S. Serikova, and Y.D. Orynbassarova (2019) that employment level is an important factor in increasing the living standards. To combat unemployment, the state creates new jobs in public areas or pays unemployment benefits, and creates various services for these purposes as well.
Our approach to the use of multiple regression to study the relationship of income with selected variables argues with the work by I.G. Yershova (2010) who suggests using pair regression for the analysis. In our opinion, multi-factor analysis produces a more effective and complex result.
We are impressed by the opinion of N.T. Vishnevskaya (2019) that non-standard employment needs to be regulated to provide those employed in this area with all the advantages of the formal economy employment. The state needs to develop legal support for all types of non-standard employment at the legislative level. Instability of non-standard employment is fraught with negative consequences for both the employee and the economy as it reduces the level and quality of life, leads to the expansion of shadow and informal sectors, and threatens the safety and health of the population.
The results of the analysis show that the use of non-standard types of employment in Kazakhstan at this stage leads to some negative consequences, mainly reduction in the population income. Among the ways to regulate these trends, the authors propose to focus the state policy on measures to adapt workers to the new economic order. Employment management policies should not only consider the development of this trend, but also reflect it in measures to regulate the situation on the labor market.
If today the main goal of state policy is to maintain the stability of employment and prevent the deterioration of a financial situation of employees, in the near future this shall not suffice. The changing conditions of economic development give priority to the task of ensuring the conditions of adaptation of workers to modern forms of employment in the labor market. This requires not only ensuring the qualitative characteristics of the labor force that meet the needs of the modern labor market, but also achieving a balance of interests between employees and employers for the optimal use of various forms of employment, where nonstandard labor relations will be given a dominant position.
Social protection plays a particularly important role for workers in non-standard employment as it allows them to receive a higher level of guaranteed income during the transition between jobs, to compensate for low earnings and ensure effective access to healthcare and other social services. It is therefore important to consider policy options to reduce worker vulnerability and to see how social protection systems can better address the needs and specific circumstances of this group of people.
We call for an increase of unemployment insurance payments, i.e., fixing the lower limit of payments, especially for the pre-retirement age, two to three years before retirement. People of pre-retirement age often switch to part-time employment and temporary contracts, and are also candidates for redundancy.
We suggest an advance notice of the employment services of possible reductions of non-standard labor contract employees for an early start of preventive work with them by these services.
References
- Chen Y. Informal Employment and China’s Economic Development / Y.Chen, Z.Xu // The Chinese Economy. — 2017. — № 6. — Р. 425–433.
- Choi K. Impact of introducing one-stop employment service centres on local employment in South Korea / K.Choi, С.Choe, D.Kang // Applied Economics Letters. — 2020.
- Estrada G. Asia’s Middle-Income Challenge: An Overview / G.Estrada, Н.Xuehui, D.Park, S.Tian // Emerging Markets Finance and Trade. — 2018. — № 6. — Р. 1208–1224.
- Hillman E. Longitudinal Analysis of Employment Success Rates of Ontario Income Assistance Clients: An Analysis by Region / E.Hillman // Journal of Poverty. — 2020.
- Johansson Sevä I. Are the self-employed really that poor? Income poverty and living standard among self-employed in Sweden / I.Johansson Sevä, D.Larsson // Society, Health & Vulnerability. — 2015. — № 1. — Р. 1–16.
- Möhring K. Employment Histories and Pension Incomes in Europe / K.Möhring // European Societies. — 2015. — № 1, Р. 3–26.
- Pritvorova T.P. Temporary and part-time employment in the European labor market: factors, trends, features / T.P.Pritvorova, S.G. Simonov, А.К.Atabayeva // Vestnik Karahandinskoho universiteta. Serija Ekonomika. — 2020. — № 3(99). — Р. 110–123.
- Sen K. Double Dividends and Mixed Blessings: Structural Transformation, Income Inequality and Employment Dynamics / K.Sen, А. Sumner, А.Yusuf // The Journal of Development Studies. — 2020. — № 9, Р.1638–1642.
- Shelomentseva V.P. Self-employment of economically active population in the region / V.P. Shelomentseva, S.V. Bespalyy, G.M. Beisembayeva, A.R. Soltangazinov // Vestnik Karahandinskoho universiteta. Seriia Ekonomika. — 2019. — № 2(94). — P. 80–87.
- Sovbetov Y. Impact of Digital Economy on Female Employment: Evidence from Turkey / Y.Sovbetov // International Economic Journal. — 2018. — № 2. — Р. 256–270.
- Тaubayev А.А. Non-standard employment in Kazakhstan: scales, tendencies and social protection measures / А.А. Legostayeva, G.S. Serikova, Y.D. Orynbassarova // Vestnik Karahandinskoho universiteta. Seriia Ekonomika. — 2019. — № 1(93). — P. 31–40.
- Tikhonova N. The Social Structure of Russian Society / N. Tikhonova // Sociological Research. — 2017. — № 4, Р. 287–307.
- Zuo H. How does informal employment impact income inequality? / H. Zuo // Applied Economics Letters. — 2016. — № 15. — Р. 1117–1120.
- Вишневская Н.Т. Государственная политика на рынке труда: реформирование институтов в странах ОЭСР / Н.Т. Вишневская // Вопросы государственного и муниципального управления. — 2019. — № 1. — С. 35– 60.
- Вишневская Н.Т. Массовое высвобождение работников: политика стран ОЭСР / Н.Т. Вишневская, А.А. Зудина // Мировая экономика и международные отношения. — 2020. — № 7. — С. 17–25.
- Ершова И.Г. Анализ и прогнозирование динамики занятости на уровне региона / И.Г. Ершова // Региональная экономика: теория и практика. — 2010. — № 30 (165). — С. 25–32.