Abstract
Object: To assess and analyze portfolio investment cash flows in various countries of the world.
Methods: Generalization, comparative analysis, dynamics of cash flow indicators.
Results: In recent years, there has been a sharp increase in sustainability-related activity in global equity markets. In a number of countries, measures were taken to strengthen public policies aimed at promoting sustainable development, which led to an outflow of portfolio investments in 2018. However, the pandemic has made significant adjustments to the cash flows of portfolio investments in the countries of the world, primarily in developed countries. As a result of the analysis, it was found that 2020 began to be characterized by negative indicators of the volume of portfolio investments.
Conclusions: Capital markets play an important role in the global investment chain. Portfolio investment is the third largest source of external finance for developing countries, and established capital markets practices can guide the sustainable development approach of investing countries around the world.
Portfolio investment, along with direct investment, is essential for the economic development of a country. Attraction of foreign investment in the economy of Kazakhstan is due to the need for sources of increasing assets of the real sector for the revival and subsequent sustainable recovery of the domestic economy, as well as new trends in the activities of foreign portfolio investors in the international financial market, the study of which will allow to form mechanisms for the development of the domestic stock market.
Portfolio investments are considered investments that do not give the investor the right to control; speculative capital. A feature of such investments at the border of countries is the potential risk of their rapid outflow due to differences between countries in the levels of remuneration on securities and interest rates in domestic markets.
The objective realities of the world economy testify to the strengthening of the globalization processes of international cross-border movement of portfolio investments as a result of the increased openness of national economies, the process of internationalization of stock markets, and the complication of financial cooperation.
While some countries are experiencing a resource crisis, others are experiencing a relative surplus of portfolio capital. Therefore, the study and analysis of the movement of portfolio investments between countries allows us to study the main directions of capital movement and identify the main reasons for attracting portfolio investments to the country’s economy. In the modern conditions of Kazakhstan’s development, foreign portfolio investments could play the role of a catalyst in intensifying investment processes in the country’s financial market.
There are many research devoted to the investment and its significance in the economic development of countries. It should be noted that domestic and Russian literature focuses on direct investment and its role in economic development. The importance of portfolio investments has been reduced because the stock markets of the CIS countries are still at an insufficient level of development. Subsequently, insufficient attention has been paid to portfolio investments.
*Corresponding author’s e-mail: akulanov23@gmail.com
Nevertheless, there are researchers who emphasize the significance of portfolio investment development in the economy growth of any country: M.V. Skripnichenko (2005), G.M. Kostunina (2005), Bekaert and Harvey (2000), L. Laeven (2003). Besides, such analysts as Chen, Zulkifli, Desai, Foley, and Hines point out considerable influence of export and import investment. The export of portfolio investments can have a positive or negative effect on domestic income depending on the role in the domestic market (Chen & Zulkifli, 2012). The import investment, if it complements domestic investment, stimulates the country’s economic growth (Desai et al., 2005).
In addition, there are studies devoted to the adverse effects of a short or long term nature. For example, Wurgler (2000) and Love (2003) considered the factors of a negative impact of portfolio investments on the economic development of a country.
It should be noted that the research mostly concerned the impact of portfolio investments on the economy of individual countries, the relationship between indicators. For example, J. Duasa and S. Kassim (2009) investigated the relationship between foreign portfolio investment and real gross domestic product of Malaysia using the widely accepted Granger causality test to establish the direction of causation between two variables. Kodongo & Ojah found that real exchange rates and foreign portfolio investment flows have changed over time (Kodongo & Ojah, 2012). Y. Waqas, S. Hashmi, M. Nazir investigated the relationship between macroeconomic factors and the volatility of foreign portfolio investment in South Asia. Accordingly, the study results suggest that foreign portfolio investors pay special attention to the country’s stable macroeconomic environment (Waqas et al., 2015). A. Abramov et al. analyzed how the lengthening of the investment time horizon affects the comparative advantages of the main asset classes, as well as the principles of building an investment strategy (Abramov et al., 2015).
However, a general study revealing a comparative analysis of portfolio investment in different countries of the world as such has not been carried out. Most of the comparative analysis was conducted between countries for direct investment (Dodonov, 2019).
During a comparative analysis, any area was considered in a systematic way. The methodological foundations of comparative analysis were concentrated on identifying the nature of connections, patterns of interaction between objects and socio-economic, cultural, and other phenomena. The analytical approach allowed us to create a picture of reality more adequately, tracing the cause-and-effect relationships that most often lie behind the narrow framework of a limited object. The result of comparing objects is a certain ordered sequence of objects, the arrangement of objects in order of preference, which makes it possible to draw appropriate conclusions about portfolio investment in different regions of the world.
Based on the main criterion choice, in this case, cash flows from portfolio investments, methods were applied. In these methods, emphasis is on cash flows, and restrictions are usually imposed on the remaining criteria. If according to this criterion there are several equivalent objects, then the next most important criterion is used, etc.
Let there be a set of data on portfolio investments of countries, assessed by k criteria - W1, W2,…, Wk. For simplicity, we will assume that the values of all criteria must be maximized, that is, we select the countries with the largest volume of funds received from portfolio investment. Let among the data set there are two x1 and x2 such that the values of all criteria W1, W2, ..., Wk for the first of them are greater than or equal to the corresponding values of the second criterion, and at least one of them is indeed greater. It makes no sense to store data x2 as part of the entire set of data, they are dominated by x1. Therefore, x2 is excluded from this set as uncompetitive, and the rest of the data are compared in a similar way.
To begin with, let us consider the aggregate volumes of portfolio investments by countries of the world over the past five years. According to the IMF, at the end of 2018, the total assets of international portfolio investments amounted to $ 58.65 trillion, of which $ 28.2 trillion accounted for investments in stocks and investment funds, and $ 30.44 trillion were investments in debt securities.
The total volume of international portfolio investments from 2002 to 2020 increased 5.16 times with an average annual growth rate of 9.3%; investments in stocks and shares of investment funds – 5.9 times with an average annual growth rate of 11.68%; investments in debt securities – 3.3 times, with an average annual growth rate of 7.67%
The dynamics show the growth and fall of the gross value of portfolio investments. According to Figure 1, in 2017, the gross value of portfolio investments increased by 25.55%.
However, the next year the situation was reversed. In 2018, the gross value of portfolio investments decreased by 8.95%. This process was accompanied by strengthening the countries’ policies on the verification of foreign investments, including portfolio investments. Many countries amended regulations that significantly expanded disclosure obligations, increased statutory review timelines or introduced new sanctions for non-compliance with notification obligations, which also led to an outflow of portfolio investments and contributed to the decline in their gross value in 2018.
In 2018–2019, capital market policies and instruments to promote sustainable development in investment moved from niche to mainstream. To improve efficiency and reduce risks, an increasing number of investors integrate environmental factors into their investment decision-making process. The positive performance of sustainability-related products reinforces the belief of asset managers and securities regulators that such factors are essential to long-term investment performance. These areas led to an increase in gross portfolio investment in 2019 by 15.89%. However, subsequently, their volumes decreased again in 2020 by 7.04% due to the pandemic (Table 1).
|
Country |
2016 |
2017 |
2018 |
2019 |
2020 |
|
Armenia |
0,426 |
0,284 |
0,224 |
0,258 |
0,335 |
|
Australia |
296,183 |
354,874 |
332,553 |
366,041 |
328,599 |
|
Azerbaijan |
1,178 |
1,629 |
1,48 |
1,604 |
1,402 |
|
Estonia |
0,113 |
0,214 |
0,123 |
0,076 |
0,085 |
|
France |
487,811 |
598,526 |
556,593 |
656,441 |
609,22 |
|
Germany |
369,66 |
489,736 |
398,767 |
464,83 |
465,083 |
|
Greece |
7,371 |
9,988 |
8,489 |
11,434 |
9,645 |
|
Israel |
64,592 |
66,211 |
64,93 |
69,562 |
76,617 |
|
Italy |
91,862 |
140,214 |
115,191 |
142,897 |
126,7 |
|
Japan |
847,316 |
1129,195 |
1007,631 |
1145,392 |
1055,511 |
|
Kazakhstan |
4,278 |
5,688 |
4,148 |
4,952 |
5,194 |
|
Latvia |
0,495 |
0,219 |
0,244 |
0,342 |
0,23 |
|
Malaysia |
29,795 |
38,681 |
32,395 |
31,649 |
27,255 |
|
Netherlands |
432,952 |
534,442 |
452,853 |
569,94 |
549,544 |
|
Poland |
20,003 |
26,669 |
21,707 |
17,113 |
13,548 |
|
Qatar |
6,415 |
7,774 |
13,158 |
17,756 |
19,875 |
|
Russian Federation |
61,74 |
69,19 |
56,599 |
83,401 |
68,791 |
|
Saudi Arabia |
3,907 |
7,823 |
7,584 |
27,965 |
0 |
|
Singapore |
114,964 |
170,7 |
88,738 |
99,007 |
81,556 |
|
Slovak Republic |
0,281 |
0,386 |
0,465 |
0,525 |
0 |
|
Slovenia |
2,157 |
1,705 |
1,634 |
1,69 |
1,52 |
|
Spain |
112,411 |
158,215 |
138,743 |
162,493 |
139,688 |
|
Turkey |
29,666 |
39,814 |
27,911 |
28,314 |
22,124 |
|
Ukraine |
8,373 |
8,978 |
7,62 |
10,232 |
8,955 |
|
Total Value of Investment |
9869,968 |
12391,814 |
11282,286 |
13075,093 |
12154,312 |
|
Note – Compiled by the authors on the basis of (IMP Data) |
|||||
Table 1. Total Portfolio Investment, USD millions
64
Вестник Карагандинского университета
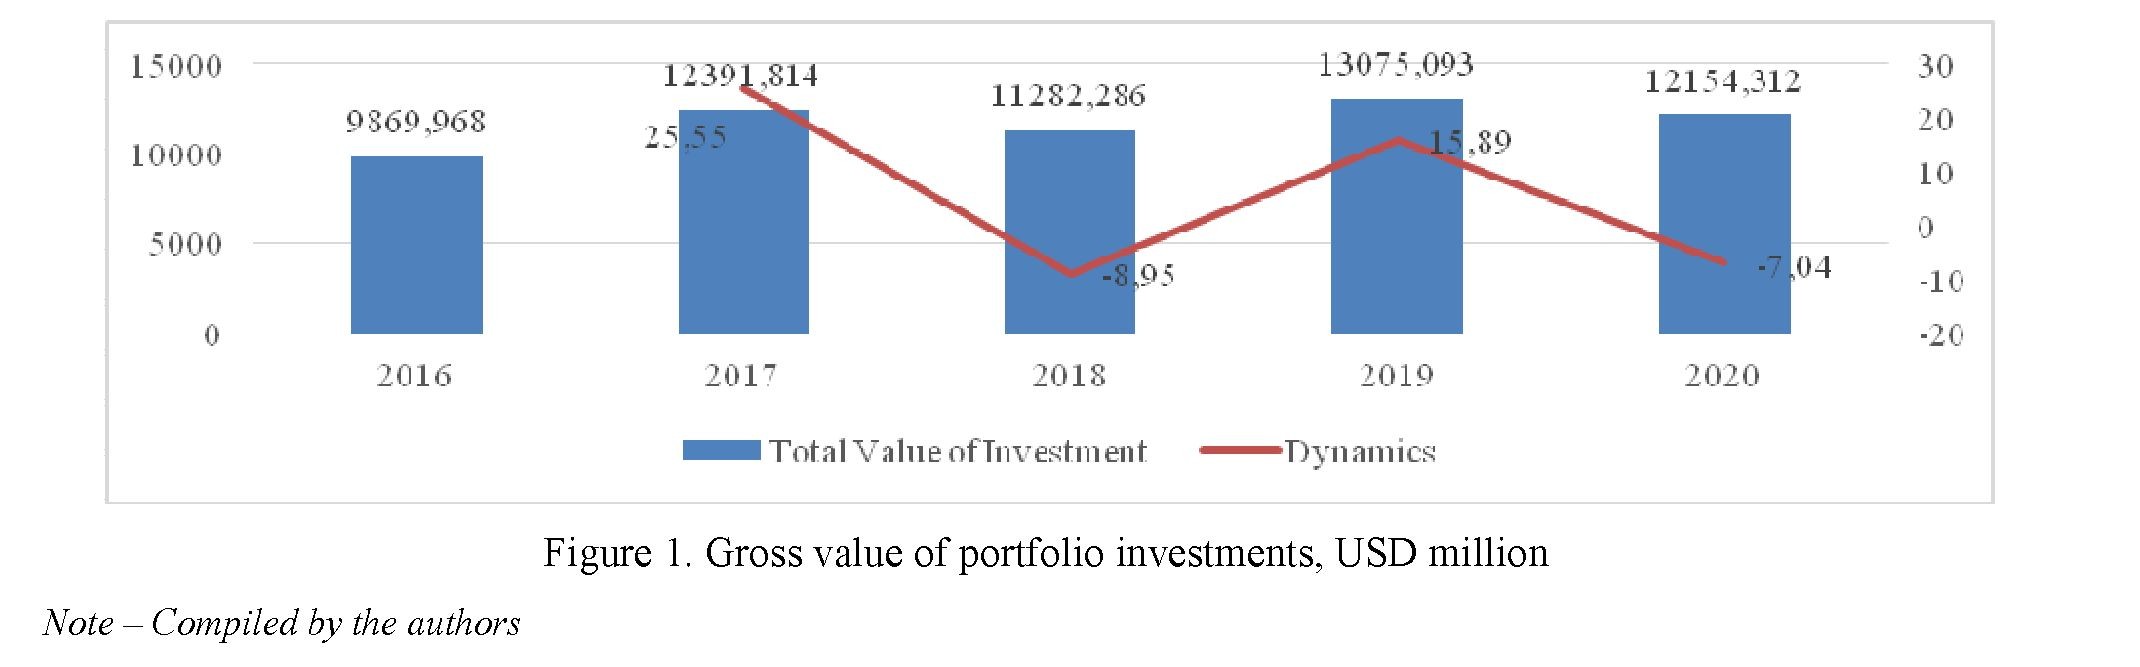
Table 1 presents the total value of portfolio investments over the past five years. The investments are volatile in each country. Japan demonstrates the most considerable growth rates in portfolio investment. France and the Netherlands show strong growth rates in recent years being the next leaders in such investments. Thus, the average growth rate in France is 19.8% per year, in the Netherlands – 16.7% per year. In comparison, Kazakhstan significantly lags behind these countries in terms of portfolio investment position. However, it is substantially ahead of many post-Soviet countries, such as Slovak, Slovenia, Latvia, Azerbaijan, Armenia, and Estonia.
In the context of the global imbalance of savings and consumption, developed countries not only actively attract capital in the form of portfolio investments but also they themselves carry out portfolio investments around the world. The modern world financial architecture is characterized by a high degree of centralization, which is confirmed by the statistics of the regional distribution of international portfolio investments.
In 2020, the top ten countries leading in terms of the volume of international portfolio investment commitments account for an average of 66% of the total volume. The Cayman Islands (7.2 times, 13.1% per year), the USA (5.8 times, 11.6% per year), Luxembourg (5.7 times, 11.43% per year), France (4.01 times, 9.07% per year). Since 2017, Italy has ceased to be among the top ten leading countries in terms of international portfolio investment obligations, and by 2018 Japan was excluded from the list of leaders; instead of them, Canada and Ireland were among the leaders, respectively.
Investments in debt securities are also concentrated in the top ten leading countries, which, on average over the past five years, account for 62% of the total global volume of international portfolio investments in debt instruments. In general, from 2016 to 2020, the total volume of portfolio investments in debt instruments increased by 2.3 times with an average annual growth rate of 5.11%.
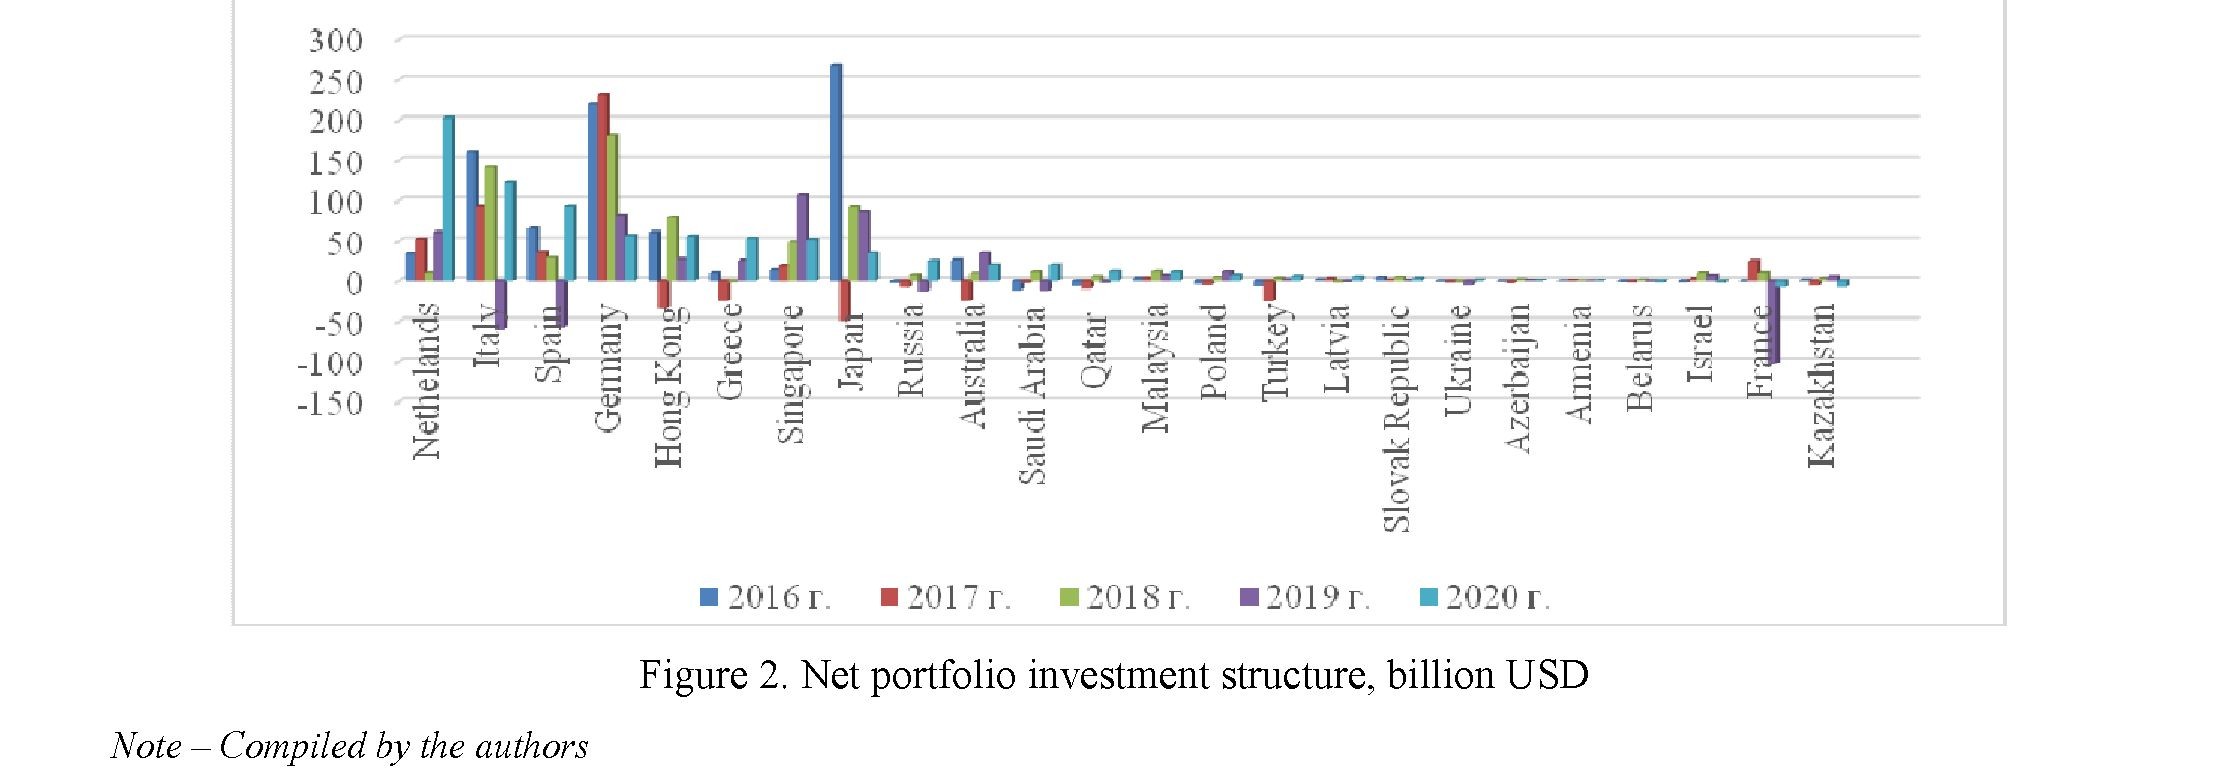
The Netherlands leads the world in net portfolio investment. As of 2020, net portfolio investment in the Netherlands was $ 202,698 million, accounting for 56.24% of the world’s net portfolio investments. The top five countries (the rest are Italy, Spain, Germany, and Hong Kong) account for 147.52% of this volume. The total volume of net portfolio investments in the world in 2020 is estimated at $ 360 445 million (Table 2).
Table 2. Net portfolio investment in current prices, billion USD
|
Country |
2016 |
2017 |
2018 |
2019 |
2020 |
|
Nethelands |
33,835 |
51,975 |
10,504 |
60,677 |
202,699 |
|
Italy |
161,138 |
93,584 |
141,541 |
-59,736 |
123,161 |
|
Spain |
64,996 |
34,992 |
28,946 |
-57,248 |
93,502 |
|
Germany |
220,072 |
232,177 |
180,412 |
81,206 |
56,783 |
|
Hong Kong |
60,529 |
-33,988 |
78,664 |
27,505 |
55,579 |
|
Greece |
10,452 |
-24,102 |
-1,224 |
25,707 |
53,376 |
|
Singapore |
14,455 |
19,714 |
49,041 |
106,452 |
51,479 |
|
Japan |
268,042 |
-49,214 |
92,912 |
86,643 |
34,412 |
|
Russia |
-2,361 |
-7,983 |
7,593 |
-12,686 |
25,296 |
|
Australia |
26,536 |
-23,976 |
9,779 |
34,34 |
20,613 |
|
Saudi Arabia |
-11,413 |
-2,539 |
12,042 |
-11,519 |
20,573 |
|
Qatar |
-6,069 |
-9,204 |
5,324 |
-2,179 |
12,549 |
|
Malaysia |
3,332 |
3,299 |
12,431 |
6,949 |
11,93 |
|
Poland |
-3,726 |
-4,593 |
4,413 |
12,266 |
7,5 |
|
Turkey |
-6,572 |
-24,251 |
3,114 |
1,447 |
5,485 |
|
Latvia |
1,247 |
2,647 |
-1,656 |
-0,705 |
4,786 |
|
Slovak Republic |
4,393 |
0,986 |
4,404 |
0,35 |
3,241 |
|
Ukraine |
-0,293 |
-1,8 |
-2,08 |
-5,134 |
0,829 |
|
Azerbaijan |
-0,488 |
-2,669 |
1,241 |
0,389 |
0,282 |
|
Armenia |
-0,034 |
0,087 |
0,033 |
-0,08 |
0,049 |
|
Belarus |
-0,646 |
-1,265 |
0,583 |
-0,501 |
-1,346 |
|
Israel |
-1,357 |
2,388 |
10,274 |
6,645 |
-2,027 |
|
France |
-0,169 |
25,22 |
10,396 |
-102,92 |
-7,776 |
|
Kazakhstan |
0,746 |
-5,398 |
2,902 |
5,127 |
-7,676 |
Note – Compiled by the authors on the basis of (The World Bank)
In 2020, the COVID–19 spread throughout the world. The forced closure of borders, quarantine measures in all countries across the world led to a halt in many economic processes. Stock markets reacted
with a crash. Thus, the American S&P 500 fell by 33.8%, the British FTSE 100 – by 33.1%, the German DAX – by 38.8%, the Chinese SSE– by 10.6%, the Russian MICEX index – by 32.2%. Following this, 10year US Treasury bonds increased in price by 7.1%, 10-year British government bonds – by 3.6%, Russian 10-year federal loan bonds at the moment lost 15.1% in price, bonds from the high yield segment lost in price by an average of 22.2% (U.S. Net International Investment Position, 2019).
To overcome this situation, countries have adopted extensive fiscal and monetary stimulus programs. Thus, in the United States, the total fiscal stimulus amounted to $ 3.0 trillion, and the Fed additionally lowered its key rate to 0-0.25. In the UK, fiscal stimulus was aimed at supporting households and private businesses - about £ 100 billion, as well as the key rate was lowered to 0.1% and the provision of liquidity through the buyback of government and non-financial bonds for £ 300 billion. In the eurozone, fiscal stimulus was introduced in the amount of € 500 billion, and monetary incentives aimed at supporting the liquidity and financial health of households, businesses and banks amounted to a total of about € 750 billion (International Monetary Fund).
On average, over the period under review, the first ten leading countries account for 74.5% of the total volume of international portfolio investments in stocks and shares of investment funds. The leader in portfolio investment was the United States, whose investments increased 5.7 times by 2018. The UK (growth 3.7 times, average annual growth rate 8.41%), Japan (growth 7.8 times, average annual growth rate 13.68%) are also active portfolio investors.
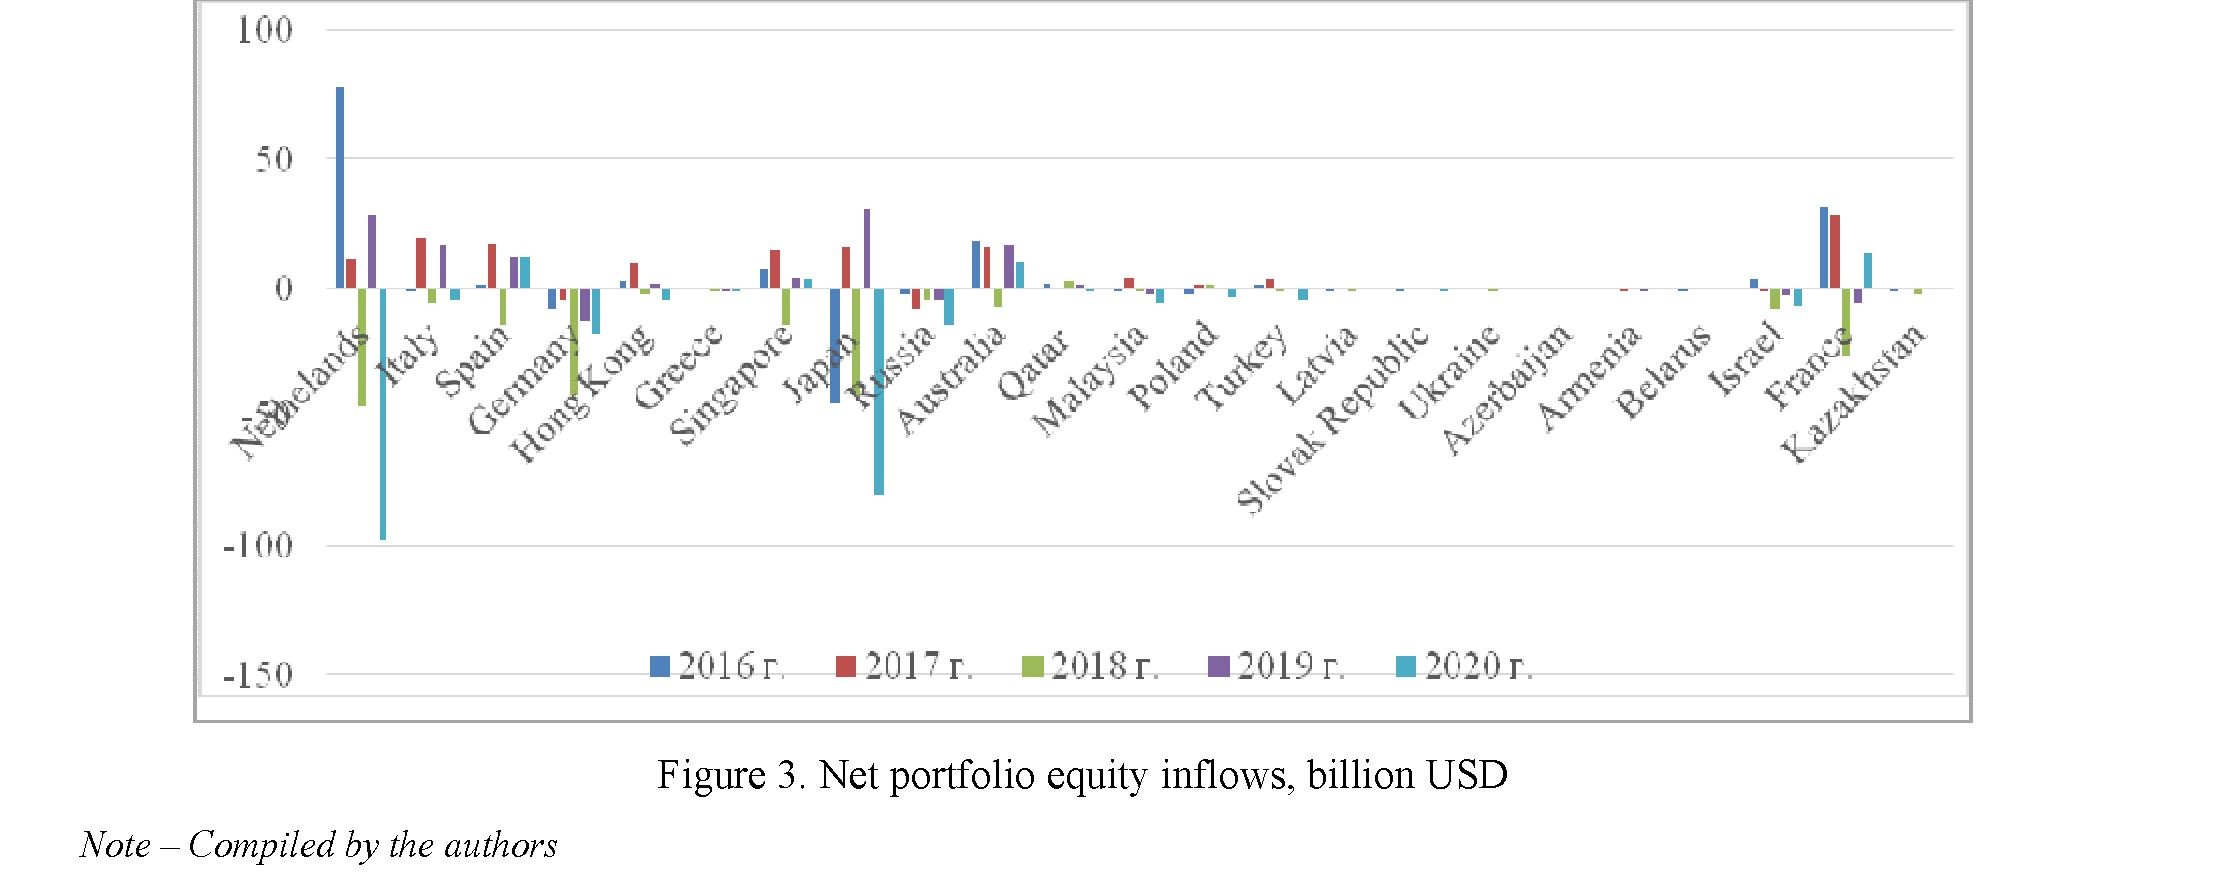
According to Figure 4, it can be noted that the first ten countries show a greater degree of portfolio investment inflow over the period under review. Negative balances were observed in 2017 in countries such as Hong Kong, Greece, Japan, Russia, Australia, Turkey, Kazakhstan. Outflows of portfolio investments in more significant volumes than inflows were observed in 2019 in countries, such as Italy, Spain, Russia, Saudi Arabia, and France.
The United States of America ranks first in the world in net inflows of portfolio capital (stocks). As of 2020, net portfolio inflows to the United States of America amounted to $ 725,724 million, representing 84.04% of global net portfolio inflows. Top five countries (USA, Luxembourg, China, Great Britain and India) account for 128.36% of this volume. The total net inflow of portfolio capital in the world in 2020 is estimated at $ 863,568 million.
|
Country |
2016 |
2017 |
2018 |
2019 |
2020 |
|
1 |
2 |
3 |
4 |
5 |
6 |
|
Nethelands |
78,1564 |
11,42685 |
-45,7856 |
28,9856 |
-97,386 |
|
Italy |
-0,989 |
19,727 |
-5,369 |
17,063 |
-4,168 |
|
Spain |
1,28778 |
17,72408 |
-14,4673 |
11,83893 |
12,4168 |
|
Germany |
-8,20477 |
-4,04258 |
-41,7325 |
-12,4263 |
-17,5114 |
|
Hong Kong |
2,50121 |
10,30941 |
-2,39738 |
1,92877 |
-4,30563 |
|
Greece |
0,53386 |
0,49448 |
-0,17333 |
-0,04377 |
-0,69082 |
|
Singapore |
7,551 |
14,701 |
-14,674 |
4,253 |
3,176 |
Тable 3. Portfolio equity net inflows in current prices, billion USD
66
Вестник Карагандинского университета
67
|
1 |
2 |
3 |
4 |
5 |
6 |
|
Japan |
-44,844 |
16,471 |
-41,679 |
30,895 |
-80,066 |
|
Russia |
-1,78802 |
-7,93987 |
-4,16386 |
-4,32008 |
-14,7941 |
|
Australia |
18,289 |
15,659 |
-7,204 |
17,101 |
11,077 |
|
Qatar |
1,728 |
0,29066 |
2,276 |
1,337 |
-0,504 |
|
Malaysia |
-0,55028 |
4,53528 |
-1,17252 |
-1,64988 |
-5,65592 |
|
Poland |
-2,516 |
1,455 |
0,949 |
0,114 |
-3,886 |
|
Turkey |
0,823 |
2,991 |
-1,131 |
0,406 |
-4,255 |
|
Latvia |
-0,03923 |
0,03953 |
-0,0008 |
0,02738 |
0,01071 |
|
Slovak Republic |
-0,03825 |
0,14791 |
0,019035 |
0,108998 |
-0,06833 |
|
Ukraine |
0,069 |
0,11 |
-0,009 |
0,049 |
0,173 |
|
Azerbaijan |
0 |
0 |
0,012 |
0,019 |
0,075 |
|
Armenia |
0,004 |
-0,003 |
0,001 |
-0,005 |
0,001 |
|
Belarus |
-0,001 |
0,006 |
0,004 |
0,007 |
0,004 |
|
Israel |
3,56 |
-0,003 |
-8,38 |
-3,17 |
-6,311 |
|
France |
31,371 |
28,592 |
-26,378 |
-5,409 |
13,423 |
|
Kazakhstan |
-0,027 |
0,022 |
-1,52 |
0,48 |
0,346 |
|
Note – Compiled by the authors on the basis of (The World Bank) |
|||||
It should be noted that 2018 and 2020 are characterized by a mostly negative balance of the cash flow of portfolio investments in equities. On average, over the period under review, the top ten leading countries account for 68.3% of the total volume of international portfolio investments in stocks. Despite the leadership of such countries as Japan, the Netherlands, France, Singapore in attracting portfolio investments in the shares of their companies, 2020 is characterized for them by a significant outflow of investments in shares due to the fall in stock markets as a whole be because of COVID–19.
Figure 5 demonstrates remarkable outflows of portfolio investments in equities in 2018 and 2020. Negative net inflows of investments in equities are especially significant in countries such as the Netherlands (-45.7856), Hong Kong (-2.39738), Singapore (-14.674), Japan (-41.679), France (-26.378), Spain (-14.4673) in USD billion in 2018 and in the Netherlands (-97.386), Japan (-80.066), Hong Kong (-4.30563), Russia (14.7941), Germany (-17.5114) billion USD in 2020.
Capital markets play an important role in the global investment chain. Portfolio investment is the third largest source of external finance for developing countries, and established capital markets practices can guide the sustainable development approach of investing countries around the world.
In recent years, there has been a sharp rise in sustainability-related activity in global equity markets. In a number of countries, measures were taken to strengthen public policies aimed at promoting sustainable de-
ECONOMY Series. № 2(106)/2022
velopment, which led to an outflow of portfolio investments in 2018. However, the pandemic has made significant adjustments to the cash flows of portfolio investments in the countries of the world, primarily in the developed countries. As a result, 2020 was characterized by negative indicators of portfolio investment volumes.
Modern exchanges and market regulators are recognizing the important role of portfolio investments in contributing to sustainable development and growing markets.
Given the dynamics and current state of international portfolio investment, we summarize that global imbalances in the global financial system have a significant impact on cross-border portfolio investment flows. It is mainly because of the influence of factors (accumulation, reserve currency, financial and legal infrastructure) that determine the behavior of global financial capital.
Overall, considering the events of 2020, the economies of the developed countries strengthened their leadership positions due to the measures of fiscal and monetary stimulation that were inaccessible to developing countries. Despite the negative impact of the pandemic on portfolio capital flows, developed countries were able to recover their positions rather quickly. The fundamental imbalances in the global economy have thereby deepened, and the asymmetry of international portfolio investment has become more pronounced. In this regard, it should be noted that global imbalances in the world economy are institutionally associated with factors that determine the behavior of global financial capital, and should be considered in relation to the field of international portfolio investment in aggregate.
References
- Abramov, A., Radygin, A., & Chernova, M. (2015). Dolgosrochnye portfelnye investitsii: novyi vzgliad na dokhodnost i riski [Long-term Portfolio investments: a new perspective on profitability and risks]. Voprosy ekonomiki, 10, 54– 77 [in Russian].
- BEA (2019). U.S. Net International Investment Position: First Quarter 2019, Year 2018, and Annual Update. bea.gov. Retrieved from https://www.bea.gov/news/2019/us-international-investment-position-1st-quarter-2019-year-2018- and-annual-update (Date of access: 07.11.21).
- Bekaert, G., & Harvey, C.R. (2000). Foreign speculators and emerging equity markets. The Journal of Finance, 55 (2), 565–613.
- Chen, J., & Zulkifli, S. (2012). Malaysian outward FDI and economic growth. Procedia - Social and Behavioral Sciences, 65, 717–722.
- Desai, M.A., Foley, F., Hines Jr., J.R. (2005). Foreign direct investment and domestic capital stock. American Economic Review Paper and Proceedings 95, 33–38.
- Dodonov, V.Yu. (2019). Mezhdunarodnoe investitsionnoe sotrudnichestvo Kazakhstana: tendentsii, faktory, perspektivy [International investment cooperation of Kazakhstan: trends, factors, prospects]. Nur-Sultan: Kazakhstan Institute of Strategic Studies under the President of the Republic of Kazakhstan [in Russian].
- Duasa, J., & Kassim, S.H. (2009). The Pakistan Development Review 48 (2), 109–123.
- IMF Data (n.d.). Coordinated Portfolio Investment Survey (CPIS). imf.org. Retrieved from https://data.imf.org/CPIS (Date of access: 21.11.2021).
- International Monetary Fund (n.d.). Policy Responses to COVID-19. Retrieved from https://www.imf.org/en/Topics/imf-and-covid19/Policy-Responses-to-COVID-19 (Date of access: 14.08.2020).
- Kodongo, O., & Ojah, K. (2012). The dynamic relation between foreign exchange rates and international portfolio flows: evidence From Africa's capital markets. International Review of Economics and Finance, 24, 71–87.
- Kostunina, G.M. (2005). Mezhdunarodnoe dvizhenie kapitala (Investitsionnaia politika zarubezhnykh stran) [International movement of capital (Investment policy of foreign countries)]. International economic relations. N.N. Liventsev (Ed.). (2nd ed.). Мoscow: ТК Belbi: prospect [in Russian].
- Laeven, L., (2003). Does financial liberalization reduce financing constraints? Financial Management, 5–34.
- Love, I., (2003). Financial development and financing constraints: International evidence from the structural investment model. Review of Financial studies, 16 (3), 765–791.
- Skripnichenko, M.V. (2016). Portfelnye investitsii [Portfolio investment]. Saint Petersburg: Universitet ITMO [in Russian].
- The World Bank. Portfolio Investment, net (BoP, current US$). data.worldbank.org. Retrieved from https://data.worldbank.org/indicator/BN.KLT.PTXL.CD (Date of access: 06.11.2021).
- Wurgler, J. (2000). Financial markets and the allocation of capital. Journal of financial economics, 58 (1), 187–214.
- Waqas, Y., Hashmi, S., & Nazir, M. (2015). Macroeconomic factors and foreign portfolio investment volatility: A case of South Asian countries. Future Business Journal, Elsevier, Amsterdam, 1, (1/2), 65–74.